
 Home/Blog
This is amazing video (with sound) of the recent explosive eruption of Mount Tavurvur in Papua New Guinea, taken by Phil McNamara. Few people in the world will ever get to witness something like this, let alone capture video of it. Note the shockwave that travels along the ground as well as through the cloud layer. I have no idea how large the boulders are that were ejected, but I suppose one could roughly estimate how high they reached by timing how long it took them to fall.
Explosive Eruption of Mount Tavurvur, Up Close and Personal
September 6th, 2014At the Crossroads: Energy and Climate Policy Summit
September 5th, 2014 I will be appearing at a 2-day conference called At the Crossroads: Energy and Climate Policy Summit, at the Hyatt Regency in Houston, TX, Sept. 25-26, 2014.
Speakers on the star-studded agenda currently include (in the order they appear):
Matt Ridley (“The Rational Optimist”)
Roy Spencer (UAH)
Judith Curry (GaTech)
Hal Doiron (The Right Climate Stuff)
Zong-Liang Yang (U. Texas – Austin)
Eric Groten (Vinson & Elkins)
Marlo Lewis (CEI)
Mike Nasi (Jackson Walker)
Rupert Darwall (“The Age of Global Warming”)
Stephen Moore (Heritage)
Marc Morano (Climate Depot)
Mark Mills (Manhattan Inst.)
Rob Bradley (Inst. for Energy Research)
Peter Grossman (Butler U.)
David Kreutzer (Heritage)
Calvin Beisner (Cornwall Alliance)
Kathleen Hartnett White (Armstrong Center for Energy and the Environment)
Caleb Rossiter (American University)
H. Leighton Steward (Plants Need CO2)
Frank Clemente (Penn State)
Standard registration is $75, while students, media, and government representatives are free.
UAH Global Temperature Update for August 2014: +0.20 deg. C
September 2nd, 2014The Version 5.6 global average lower tropospheric temperature (LT) anomaly for August, 2014 is +0.20 deg. C, down from July’s value of +0.31 deg. C (click for full size version):
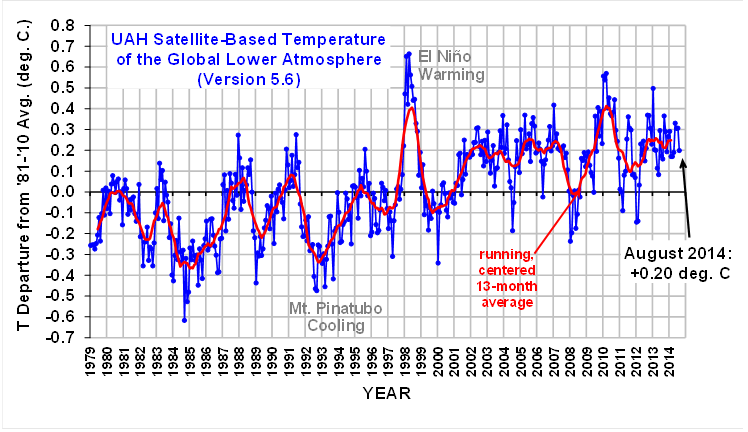
The global, hemispheric, and tropical LT anomalies from the 30-year (1981-2010) average for the last 20 months are:
YR MON GLOBAL NH SH TROPICS
2013 1 +0.497 +0.517 +0.478 +0.386
2013 2 +0.203 +0.372 +0.033 +0.195
2013 3 +0.200 +0.333 +0.067 +0.243
2013 4 +0.114 +0.128 +0.101 +0.165
2013 5 +0.082 +0.180 -0.015 +0.112
2013 6 +0.295 +0.335 +0.255 +0.220
2013 7 +0.173 +0.134 +0.211 +0.074
2013 8 +0.158 +0.111 +0.206 +0.009
2013 9 +0.365 +0.339 +0.390 +0.190
2013 10 +0.290 +0.331 +0.249 +0.031
2013 11 +0.193 +0.160 +0.226 +0.020
2013 12 +0.266 +0.272 +0.260 +0.057
2014 1 +0.291 +0.387 +0.194 -0.029
2014 2 +0.170 +0.320 +0.020 -0.103
2014 3 +0.170 +0.338 +0.002 -0.001
2014 4 +0.190 +0.358 +0.022 +0.092
2014 5 +0.326 +0.325 +0.328 +0.175
2014 6 +0.305 +0.315 +0.295 +0.510
2014 7 +0.304 +0.289 +0.319 +0.451
2014 8 +0.199 +0.244 +0.154 +0.060
It should be remembered that during ENSO, there is a 1-2 month lag between SST change and tropospheric temperature changes, so what the SST anomaly is doing lately gives you a rough idea of how the tropospheric temperature anomaly will be changing in a couple of months.
The global image for August should be available in the next day or so here.
Popular monthly data files (these might take a few days to update):
uahncdc_lt_5.6.txt (Lower Troposphere)
uahncdc_mt_5.6.txt (Mid-Troposphere)
uahncdc_ls_5.6.txt (Lower Stratosphere)
A Question for My Readers: Lenz’s Law, Magnetism, and Copper
August 29th, 2014This has nothing to do with climate…that I know of.
I have a question for any readers who know about how magnets and conductors work, like in an electric motor.
There are some cool videos showing how you can drop a powerful magnet through a copper tube, and it falls very slowly. Here’s my favorite, which involves a huge magnet and an even more impressive piece of copper (see especially 0:40 to 0:44):
According to Lenz’s Law, the electrical current generated in the copper by the falling magnet generates an opposing magnetic field which slows the fall of the magnet.
I’ve ordered a small version of the disk magnet, 1.5″ by 1″, which is supposed to hold 146 lbs (!). Rather than getting 2″ diameter copper tube to drop it through, I plan on wrapping copper wire (say #12 or #14) around a piece of PVC pipe.
My question is this: How can I wrap the wire to maximize the slow-fall effect? Or is a solid copper tube going to provide the maximum effect? Does the amount of copper (thickness of the tube wall, number of copper windings) have an impact?
I suppose I can answer this with some experimentation, but I’d like to know a little more about the variables (which I assume are all transferable from electric motor design) ahead of time.
Thanks!
Volcanic Eruptions in Iceland and Papua New Guinea
August 29th, 2014Threatening earthquake activity for many days finally culminated in an eruption of the Bardarbunga volcano in Iceland early this morning.
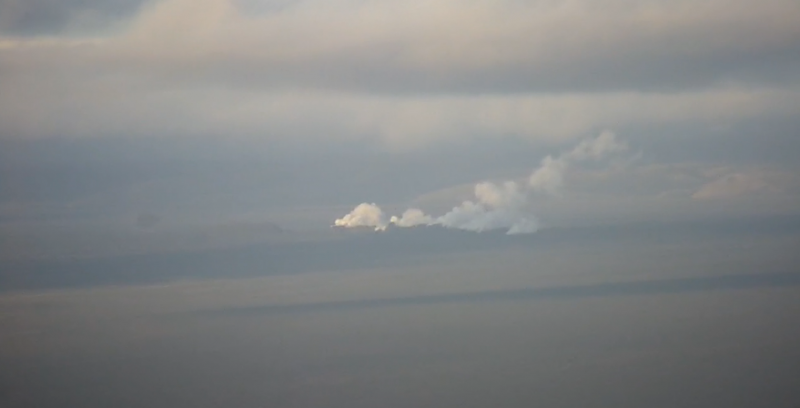
Bardarbunga volcano webcam screenshot at 7:33 am August 29, 2014.
The eruption seems to be mainly lava at the surface, but a larger explosive ash eruption is still possible, which is what would be required to have any effect on global climate.
A more spectacular eruption occurred in Papua New Guinea about the same time. Tavurvur volcano erupted with an ash cloud reaching to 60,000 ft. altitude, a beautiful photo of which was taken by Joyce Lessimanuaja and tweeted by Shelley Hendel (@shelleyjlh):
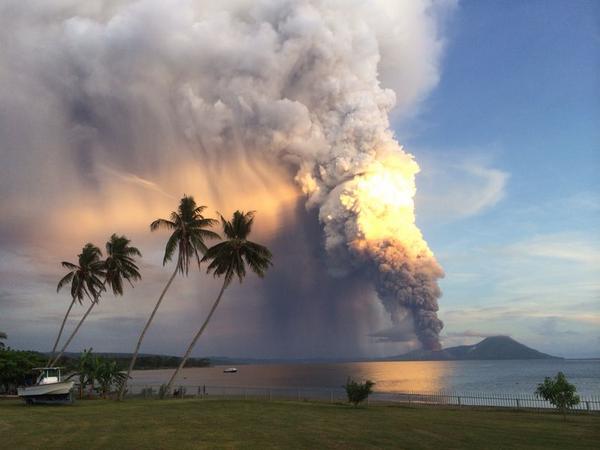
Eruption of Tavurvur volcano in Papua New Guinea on the morning of 29 August 2014.
This eruption barely showed up on NASA MODIS imagery this morning, so I doubt it will result in any climate effects, either.
There is also some pretty awesome video of the Tavurvur eruption, which was very fiery:
Another Global Warming Casualty: Death Valley’s Sliding Rocks to Stop Sliding
August 28th, 2014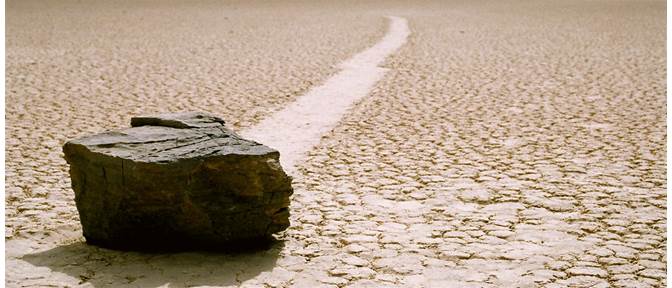
Sliding rock on Racetrack Playa, Death Valley, CA (photo by TahoeNathan)
I thought I would make this connection before someone else (inevitably) does.
In case you hadn’t heard, the sliding rock mystery of Racetrack Playa in Death Valley has been solved. Researchers have witnessed rocks being shoved around by wind-blown ice that forms after rare winter rains.
Now, you might recall that Death Valley is now officially the hottest place on Earth.
Ice shoving rocks around. At the hottest place on Earth.
Clearly, this is another example of one more thing that will change with global warming. No more ice in Death Valley.
No more water to freeze anyway, because of increased drought.
So, no more sliding rocks at Racetrack Playa. They will have to rename it Motionless Rock Playa.
You heard it here first.
How Much of Atmospheric CO2 Increase is Natural?
August 27th, 2014NOTE: The following post has led to many good comments. The best argument advanced that I am wrong is from a ~1,000 year record of CO2 from the Law Dome ice core (a record I was unaware of) which suggests the recent CO2 increase is almost entirely anthropogenic in origin.
I frequently get asked the question, if natural CO2 emissions are about 20 times what anthropogenic emissions are, how do we know that all of the atmospheric CO2 increase is due to human activities?
One answer often given (and the one I often use, too) is that since we emit twice as much as is needed to explain the atmospheric increase, there is no reason to look elsewhere. Just assume the huge natural sources and sinks of CO2 are in balance, and then humans are responsible for the small changes we see.
Natural Variations in CO2 are LARGE
But what if (I’m NOT necessarily advocating this) most of the CO2 humans produce, which is near the land surface, is absorbed by vegetation, and the observed global increase is partly or mostly due to outgassing of the oceans?
Scientists seem to make the assumption that nature is always in balance. But this clearly isn’t the case for natural sources and sinks of CO2 (you can find such plots in the IPCC reports, too):
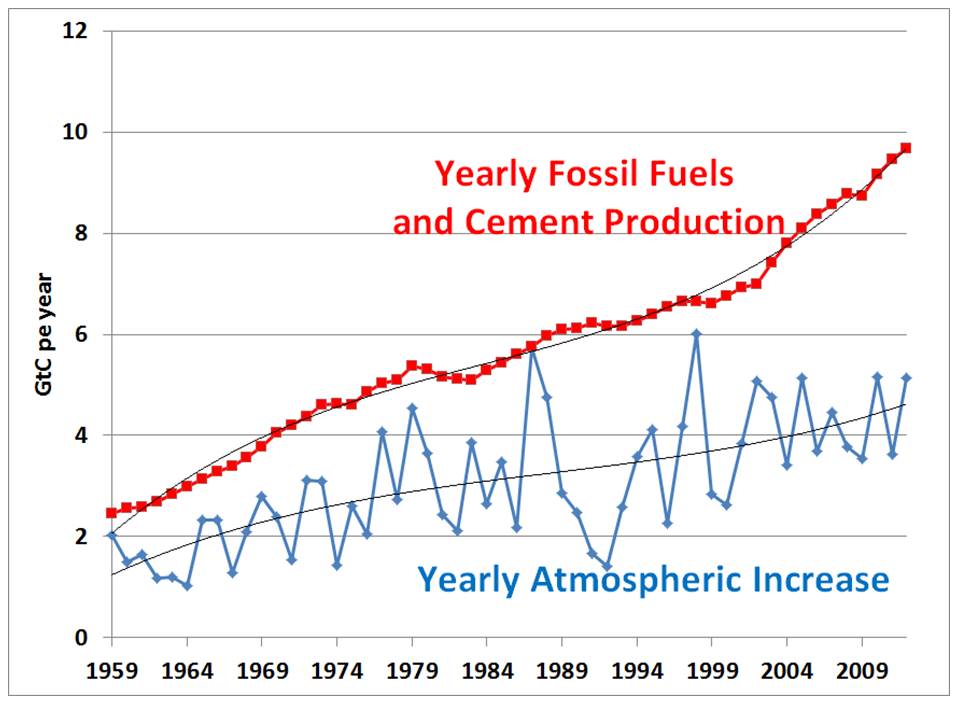
Fig. 1. Yearly anthropogenic CO2 emissions versus yearly increases in atmospheric CO2.
There are obviously some very large natural yearly imbalances in CO2 sources and sinks, with the atmospheric yearly increase ranging anywhere from 23% to 100% of anthropogenic emissions. If the yearly fluctuation are this large, how do we know that nature is in long-term balance for CO2 sources and sinks? The answer is, we don’t. This is why NASA launched the OCO-2 satellite, to try to get a better handle on the regional sources and sinks of CO2 around the world.
Furthermore, in contradiction to IPCC predictions, the ability of the Earth to absorb extra CO2 seems to be increasing with time: the equivalent of 40% of our emissions were being absorbed early in the record, a fraction which has increased to 50% late in the record.
Given these very large year-to-year variations, is it that unreasonable to hypothesize that there might be a long-term natural imbalance between natural sources and sinks of CO2, which is also contributing to the observed increase?
The trouble carbon budget modelers have with this possibility is that it would require that there are even stronger sinks of anthropogenic CO2 emissions at work, and the IPCC is already having trouble explaining where all of the �extra� CO2 is going.
For example, rather than nature normally being in perfect balance and then absorbing ~50% of our CO2 emissions, nature would have to be absorbing (say) 75% of our emissions but contributing the remainder to the observed atmospheric increase from a natural source elsewhere.
We really don�t know where these sources and sinks are�all we see is the net result of all of them expressed in the average atmospheric concentration. Like your bank balance representing the net effects of all deposits and withdrawals.
Carbon Isotopes
The arguments from carbon isotopes (C13…sorry for the unconventional notation) that fossil fuels are the source of all the atmospheric increase don�t hold water as far as I can tell. As I posted nearly 6 years ago, the C13 fraction in the long-term trends of atmospheric CO2 are not inconsistent with a natural source, after I examined the observed C13 variations at three time scales: seasonal, interannual, and long-term trends:
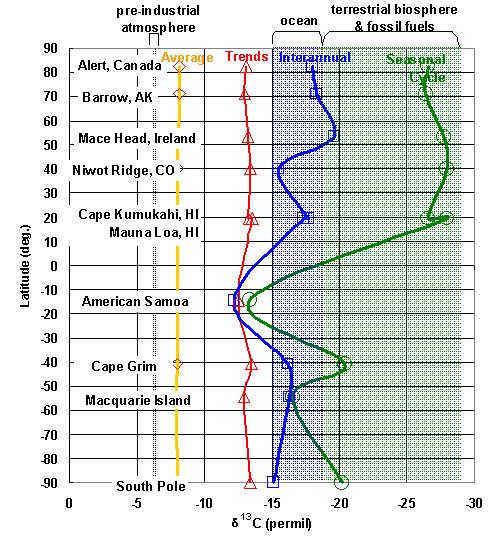
Fig. 2. C13 fraction variations contained in seasonal versus, interannual versus decadal variability, compared to known geophysical sources.
I believe that pointing this out is part of the reason why Murray Salby got into trouble recently. The scientific community doesn’t take kindly to some of us suggesting nature itself might be causing “carbon pollution”. Baaad scientist.
If I am misunderstanding something about the C13 arguments, someone please let me know, since I�m not an expert in atmospheric chemistry. Ferdinand Engelbeen kindly responded to my post from 2009, and if he would like to provide an updated argument I would be glad to post it here.
A Simple Analysis: Could 40% of the CO2 Increase be Natural?
I downloaded from CDIAC the latest spreadsheet with the yearly global CO2 source and sink estimates, for the period 1959 through 2012. I wanted to address the question: from a statistical point of view, how much of the year-to-year changes in atmospheric CO2 can be explained by different sources and sinks?
The spreadsheet includes yearly estimates of (1) atmospheric increase in CO2, (2) fossil fuel and cement production of CO2, (3) an estimate of the ocean CO2 sink, (4) an estimate of land use change emissions CO2 source, and I added to these variables (5) global land surface temperature [CRUTem4], and (6) global sea surface temperature [HadSST3].
As a first step, if we do simple correlations between the atmospheric CO2 variations with the other variables we find the highest correlation between temperature and CO2, and a little lower correlation with anthropogenic emissions:
Correlations with Yearly Atmospheric CO2 increases (1959-2012)
T_ocean : 0.70
T_land: 0.71
Fossil Fuels: 0.67
Ocean sink: 0.63
Land Use: -0.36
The fact that temperature has a higher correlation with yearly CO2 changes than does the anthropogenic source shows just how strongly the temperature variability affects atmospheric CO2 content.
But correlating data with substantial trends in the data can be deceiving. Strictly speaking, all linear trends are perfectly correlated with each other, even those which have no causal relationship whatsoever between them.
So, we can detrend all of the data, and see what information is contained in the departures from the linear trends. This reduces the correlations substantially, since the variability associated with the trends has been removed:
Correlations with Yearly Atmospheric CO2 variations (1959-2012, detrended)
T_ocean : 0.35
T_land: 0.34
Fossil Fuels: 0.13
Ocean sink: 0.01
Land Use: 0.00
We see that the correlation between atmospheric CO2 and temperature remains the strongest, but the fossil fuel signal is very small, possibly because the detrended variations in anthropogenic emissions are quite small, and so subject to greater errors.
The ocean sink and land use estimates seems to have no correlation with atmospheric variations after detrending, and so were excluded from further analysis.
If we then perform a multiple regression between atmospheric CO2 versus the anthropogenic source and 2 temperature terms (all detrended), and apply the resulting coefficients to the original (not detrended) data, we get the following plot:
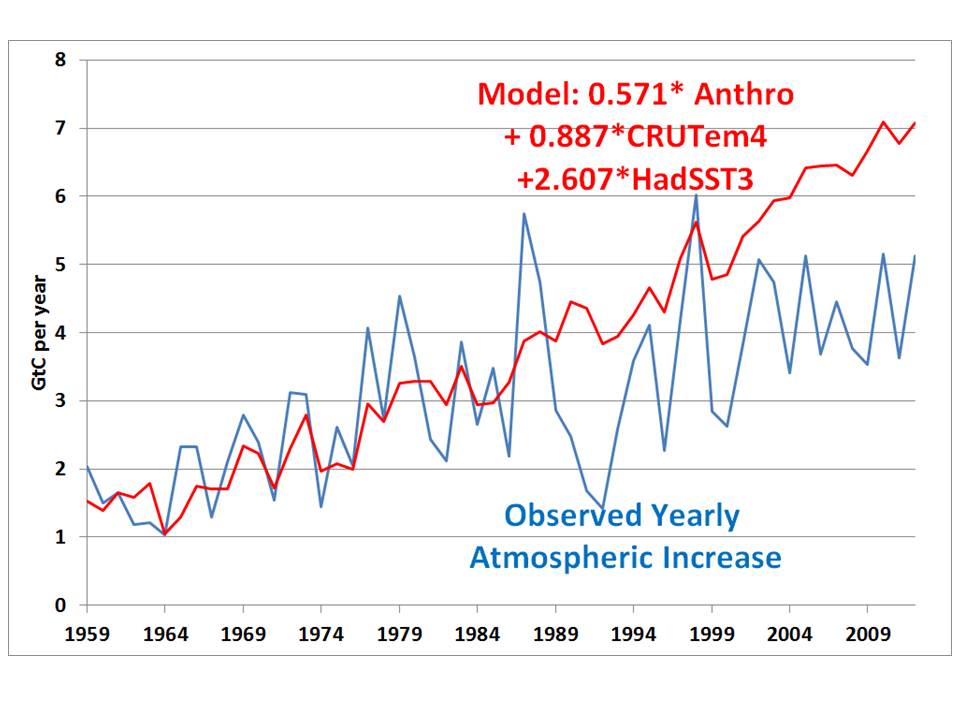
Fig. 3. Yearly changes in atmospheric CO2 in observations versus a simple statistical model trained with detrended anthropogenic emissions and temperature data.
At face value, what this plot shows is that the observed increase in atmospheric CO2 can be easily explained (actually, �over-explained�) with a combination of anthropogenic emissions and increasing temperatures, where the quantitative relationships are based upon detrended data. The contributions to the model trend in atmospheric CO2 is 61% anthropogenic, 22% ocean temperature, and 17% land temperature.
The model overshooting of the trend could be due to some unknown carbon sink which isn�t directly related to surface temperature. Or, it could just be an artifact of the poor assumptions inherent in the simple statistical model (e.g. that the interannual relationship between temperature and CO2 applies to long-term trends).
Conclusions
By itself I don�t think this �proves� anything. But it does show that since warm years tend to cause greater natural emissions of CO2 into the atmosphere, we should at least consider the possibility that the long-term warming trend (whatever its cause) is contributing to the increase in atmospheric CO2.
What caused the warming that caused the CO2 increase? Well, as I have been saying for years, chaotic circulation-induced changes in cloud cover can cause global warming or cooling. Or pick some other mechanism. Maybe that big ball of fire in the sky.
My point is, the climate system is not static.
We should remember how much we have anthropomorphized recent warming: Human activities produce CO2 in reasonably well known amounts, humans do the monitoring of CO2, then humans do the modeling. Since we really don�t understand the natural sources and sinks very well — not to the <1% level needed to document that a �natural balance� exists (since human emissions are now close to 5% of natural sources and sinks) -- we just assume they are “in balance”. There, problem solved.
So, we impose a human explanation on what we observe in nature. A common tendency throughout human history. We are searching for answers at night under the only streetlamp where we can see.
UPDATE: I didn’t address the fact that atmospheric O2 concentrations have fallen commensurate with the rise in atmospheric CO2, which is supposedly “proof” of fossil fuel burning being the 100% cause of atmospheric CO2 increase. But increased oxidation of organic matter has the same effect on O2.
Update #2:Just to clarify…even if all of the atmospheric CO2 increase is manmade, I continue to believe it is more beneficial than harmful.
Technically, Scott Brown is Correct
August 26th, 2014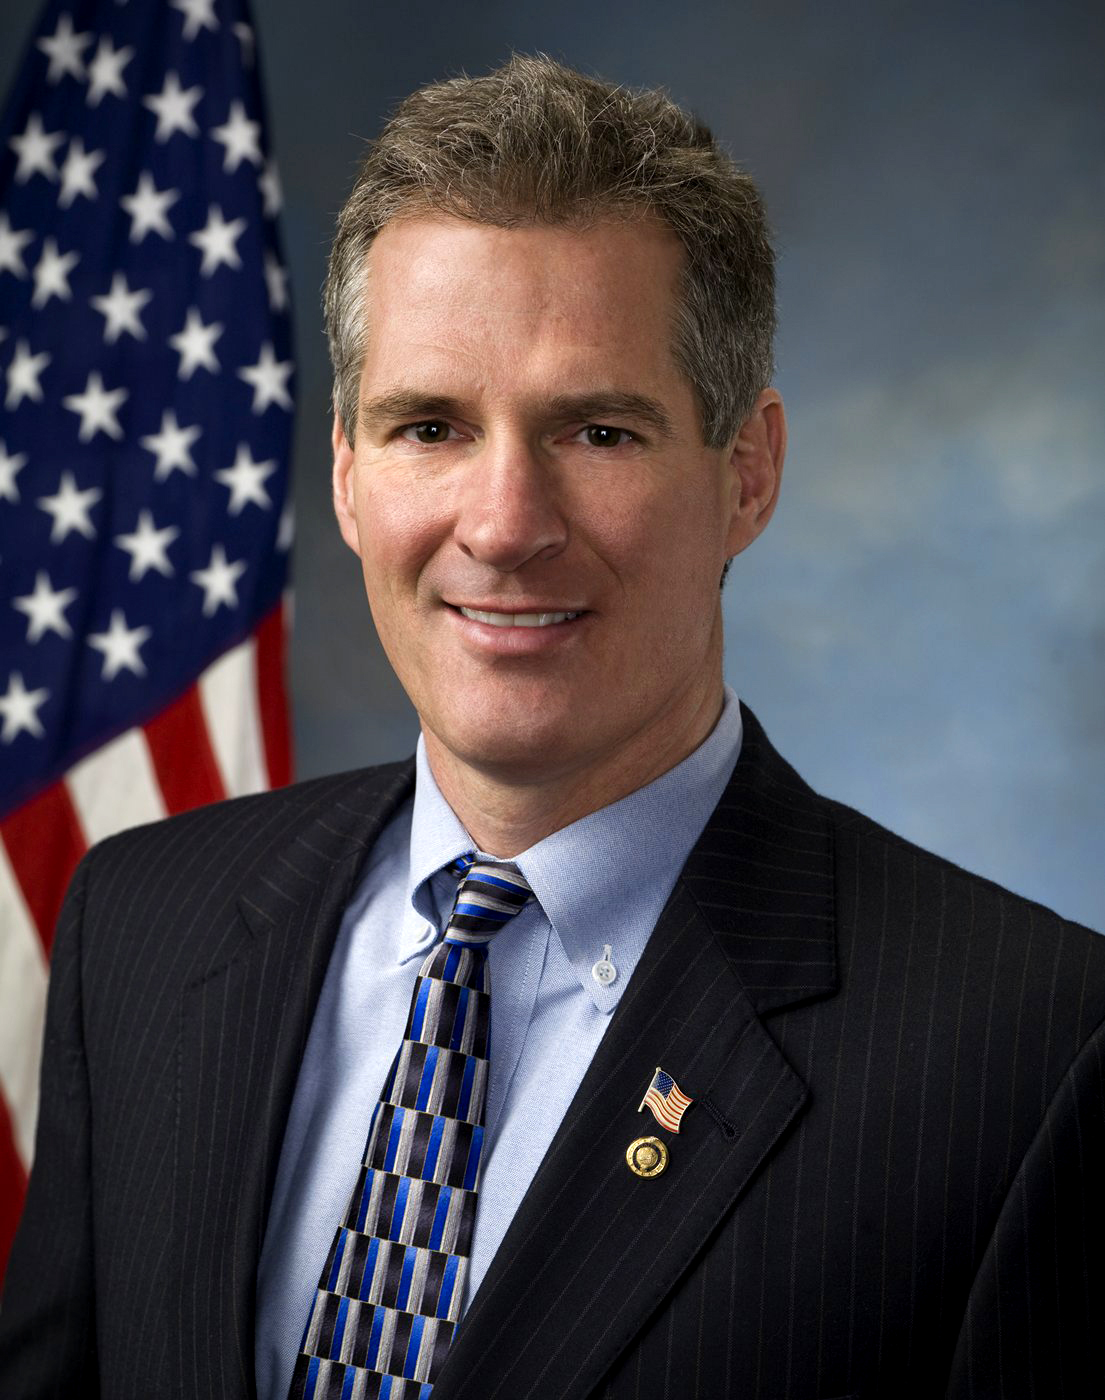 Gawd, I wish the media were as smart as they think they are.
Scott Brown, Republican candidate running to be a senator from New Hampshire, on Saturday participated in a debate during which he was asked if he believed:
“…the theory of man-made climate change has been scientifically proven”.
Now, first of all, nothing is science is “proven”. If you think it is, you don’t understand science.
Brown’s answer to the question was “no”. And that is correct. There is no way to prove that our addition of 1 molecule of CO2 to each 10,000 molecules of atmosphere over the last 100 years has had any measurable influence (there are no fingerprints of human-caused versus natural warming).
All the usual left-leaning news outlets have been having a cow over this supposed reversal of Brown’s position. The ThinkProgress site entitled their article, “Scott Brown Flips to Full-Blown Climate Denier“.
The “flip” is because Brown had previously (in 2012) said that climate change was “a combination between man-made and natural” in origin.
And that statement, too, is correct. As a climate researcher, I also believe it is some (unknown) combination. But there is no way to “prove” it.
I haven’t been following the race, and so have no opinions on the candidates. I’m just pointing out that Scott Brown’s position is entirely defensible, and the media conveniently hears what they want to hear.
If the media can’t ask a technical question correctly, they shouldn’t ask the question.
Or, don’t ask one question, then assume the resulting answer is to a different question.
The People’s Climate March. Do it for the Kittens!
August 25th, 2014Crazy Man to Live on Iceberg for 1 Year
August 24th, 2014
I suppose this was inevitable.
An adventurer who has rowed solo across oceans and jogged a total of 4 lightyears is going to bring attention to global warming (what’s that?) by living on a Greenland iceberg for up to a year starting next Spring.
As reported by TreeHugger.com, Alex Bellini, a “professional adventurer” from Italy, will chronicle the melting of the iceberg (which, of course, never happened in summer before humans began burning fossil fuels).
For those new to how high-quality science works, Mr. Bellini explains in his own words (emphasis mine):
“My objective is reporting and investigating, by means of scientific methods, the entire lifetime of an iceberg. I want to prove how the pace of ice-melting has dramatically accelerated over the last decades.”
How exactly he is going to do that by sitting on an iceberg as it melts in the summer, which is what icebergs do anyway, remains to be seen.
The sad part is the number of people who will fall for this. Probably including Mr. Bellini himself. Pure publicity stunt, no scientific value whatsoever.
I guarantee you if he does camp out on an iceberg, he will not stay there a year. Greenland winters are brutal.


