Archive for 2018

Giving Credit to Willis Eschenbach

Monday, December 31st, 2018

The non-greenhouse theory of Nikolov (and now Zeller-Nikolov) continues to live on, most recently in this article I’ve been asked about on social media.

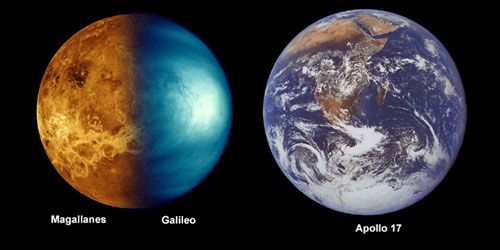
In short, it is the theory that there really isn’t a so-called “greenhouse effect”, and that the excess planetary surface temperatures on Earth, Venus, and other planets above the Stefan-Boltzmann (SB) temperature calculated from the rate of absorbed solar radiation is due to compressional heating by the atmosphere.

This is a popular alternative explanation that I am often asked about. Of course, if there is no “greenhouse effect”, we don’t have to worry about increasing CO2 in the atmosphere and all of the global warmmongers can go home.

I have posted on this blog many times over the years all of the evidences I can think of to show there really is a greenhouse effect, but it is never enough to change the minds of those who have already convinced themselves that planetary surface temperatures are only a function of (1) absorbed sunlight and (2) atmospheric pressure, as Zeller and Nikolov claim.

I’ve always had the nagging suspicion there was a simpler proof that the Zeller-Nikolov theory was wrong, but I could never put my finger on it. My co-worker, Danny Braswell (a PhD computational physicist) and I have joked over the years that we tend to make problems too difficult… we’ve spent days working a problem when the simple solution was staring us in the face all along.

Enter citizen scientist Willis Eschenbach, a frequent contributor at Wattsupwiththat.com, who back in 2012 posted there a “proof” that Nikolov was wrong. The simplicity of the proof makes it powerful, indeed. I don’t know why I did not notice it at the time. My apologies to Willis.

Basically, the proof starts with the simplified case of the average planetary temperature without an atmosphere, which can be calculated using a single equation (the Stefan-Boltzmann equation). Conceptually, in the absence of an atmosphere, sunlight will heat the surface and the temperature will rise until the rate of emitted infrared radiation from the surface to outer space equals the rate of absorbed solar energy. (To be accurate, one needs to take into account the fact the planet is rotating and spherical, the rate of heat conduction into the sub-surface, and you also need to know the planet’s albedo (solar reflectivity) and infrared emissivity).

The SB equation always results in a surface temperature that is too cold compared to surface temperatures when an atmosphere is present, and greenhouse theory is traditionally invoked to explain the difference.

Significantly, Willis pointed out that if atmospheric pressure is instead what raises the temperature above the S-B value, as the Zeller-Nikolov theory claims, the rate of energy loss by infrared radiation will then go up (for the same reason a hotter fire feels hotter on your skin at a distance). But now the energy loss by the surface is greater than the energy gained, and energy is no longer conserved. Thus, warming cannot occur from increasing pressure alone.

In other words, without the inclusion of the greenhouse effect (which has downward IR emission by the atmosphere reducing the net loss of IR by the surface), the atmospheric pressure hypothesis of Zeller-Nikolov cannot explain surface temperatures above the Stefan-Boltzmann value without violation of the fundamental 1st Law of Thermodynamics: Conservation of Energy.

This is a simple and elegant proof that radiation from the atmosphere does indeed warm the surface above the S-B value. This will be my first go-to argument from now on when asked about the no-greenhouse theory.

I like to give credit where credit is due, and Willis provided a valuable contribution here.

(For those who are not so scientifically inclined, I still like the use of a simple hand-held IR thermometer to demonstrate that the cold atmosphere can actually cause a warmer surface to become warmer still [and, no, the 2nd Law of Thermodynamics is not violated]).

2018 6th Warmest Year Globally of Last 40

Thursday, December 20th, 2018

Even before our December numbers are in, we can now say that 2018 will be the 6th warmest year in the UAH satellite measurements of global-average lower atmospheric temperatures, at +0.23 deg. C (+0.41 deg. F) above the thirty-year (1981-2010) average.

(Jan. 2, 2019 update confirms this.)

The following plot ranks all of the years from warmest to coolest, with the ten warmest and ten coolest years indicated:

The first (1979) and last (2018) years in the record are indicated in purple.

2018 is also the 40th year of satellite data for monitoring global atmospheric temperatures.

We are currently working on Version 6.1 of the dataset, which will have new diurnal drift corrections. Preliminary results suggest that the resulting linear warming trend over the 40 years (+0.13 C/decade) will not change substantially, and thus will remain considerably cooler than the average rate of warming across the IPCC climate models used for energy policy, CO2 emissions reductions, and the Paris Agreement.

The Five Questions Global Warming Policy Must Answer

Tuesday, December 18th, 2018

It is no secret that I doubt increasing CO2 in the atmosphere will have enough negative effects on the global environment to warrant the extreme cost to humanity of substantially reducing those effects. Note that this statement has both science and energy policy components. In fact, with “global greening” we should consider the possibility of net positive benefits.

The public perception of global warming risks has involved a mixture of exaggerated claims regarding both the science and the energy policy, instigated by a minority of activist scientists and amplified by an eager news media. In my Kindle e-book Global Warming Skepticism for Busy People, I list 5 questions I believe must be answered in the affirmative before embarking on any large-scale decarbonization of the global economy:

The Five Big Questions
1) Is warming and associated climate change mostly human-caused?
2) Is the human-caused portion of warming and associated climate change large enough to be damaging?
3) Do the climate models we use for proposed energy policies accurately predict climate change?
4) Would the proposed policy changes substantially reduce climate change and resulting damage?
5) Would the policy changes do more good than harm to humanity?

As I state in my book, it is not obvious that the answer to any of the five questions is yes, let alone all of them. The first three questions deal with the science, and the last two deal with energy policy.

Regarding the first question, I might concede it is indeed possible most of the warming since the 1950s is human-caused. This is a core conclusion of the IPCCs 5th Assessment Report (AR5).

But so what? What it acknowledges is rather unremarkable, given (as we will see) the rather slow rate of global warming. As the second question asks, is the human component large enough to cause substantial damage? There has yet to be any good evidence produced that weather extremes are worse in recent decades than in previous centuries. Even warming itself appears to have begun in centuries past, before humans could be blamed, with proxy evidence of previous receding glaciers and low Arctic sea ice extent (and very high extent during the Little Ice Age) begging the questions of just how large natural climate variations have been, and what is the naturally preferred state of the climate system anyway?

This leads to the third question, which has to do with the fact the latest generation of climate models produce, on average, about 2 times too much warming compared to the rates at which the global surface temperature and deep ocean have observed to have been warming, with the latest energy budget study (which makes the same climate forcing assumptions over the last 100+ years as the models) suggesting more like 1.6 deg. C of eventual warming from a doubling of atmospheric CO2, rather than 3.2 deg. C projected by the average climate model. (And even THAT assumes ALL of the warming is human-caused!)

In the last 40 years, the discrepancy between models and observations for the globally-averaged lower atmosphere looks like this:

The discrepancy in the surface temperatures is less dramatic, but growing:

How can such models, which are increasingly portrayed as accurate, be defended with a straight face for energy policy decisions? The amount of warming they produce is not based upon physical first principles, as is often claimed. That some warming should occur is based upon fairly solid principles, but the amount of warming from increasing CO2 is entirely debatable.

The dirty little secret is that the models are tuned so that only increasing CO2 causes warming, since the various uncertain sources of natural climate change are either not known well enough to include, or are purposely programmed out of the models. (How do I know? Because NONE of the natural energy flows in and out of the climate system are known to the accuracy [about 1%] needed to blame recent warming on increasing CO2, rather than on Mother Nature. Those natural energy flows in the models are simply forced to be in balance, and so the cause of model warming ends up being anthropogenic. Thus the models use circular reasoning to establish human causation.)

The fourth and fifth questions have to do with whether we can really reduce CO2 emissions as long as humanity needs fossil fuels to reduce poverty and create prosperity. I have nothing against alternative energy sources per se, as long as they are practical and cost-competitive. Everything humanity does requires energy, and as long as China and India continue to reduce poverty with ever-growing usage of fossil fuels, global CO2 emissions will continue to increase, no matter what the United States does. With about 1 billion people in the world still without electricity, I believe it is immoral to deprive them of access to affordable energy.

Out of the 5 Big Questions, which are most important? Ultimately, economics is what rules peoples lives. Poverty kills, and forcing people to use more expensive energy will worsen poverty.

In France we are seeing the violent push-back against green energy policies (among other , mainly economic, issues), and we havent even yet reached the point where policies will reduce future CO2 emissions by enough to measure the effect by the end of this century in terms of global temperature. So, if you think the Paris riots are bad, wait until you see the public response to policies that will reduce future CO2 emissions by, say, 50%.

But we cannot ignore the science. What if the science was absolutely certain we were in for 20 deg. C of warming and a collapse of the Antarctic ice sheet, with 200 ft. of sea level rise? Then humanity might be willing to make large sacrifices to save itself. So, the science does matter… the question is, can it be trusted?

Based upon the observed rate of global warming (which is too small for any individual to feel in their lifetime), and failed climate model projections, I’d say the current state of the science is not yet ready for primetime.

For now, the science supports some modest and mostly harmless warming, but not enough warming to justify CO2 emissions reductions that would destroy the global economy, worsen global poverty, and have no measureable effect on global temperatures by the end of this century anyway.

Allstate Should Pull this Ad and Apologize for Misleading the Public

Monday, December 17th, 2018

I’ve been meaning to comment about this TV ad for Allstate insurance, which enraged me the first time I saw it. Allstate knows better (the insurance business deals with probability and statistics) and they knew this was a lie when they put the ad together:

In the ad, actor Dennis Haysbert says:

“A once-in-500-year storm should happen once every 500 years, right? The fact is, there have been 26 in the last decade.”

Setting aside the fact that we don’t have enough statistics to say anything meaningful about what happens over 500 years (hydrologists prefer to stick to 100 years as justified when talking about rare events), Allstate knows very well that such statistics refer to the repeat period for the same location… not for (say) the whole United States. It is not unusual for once-in-100 year weather events to occur more than once, maybe several times, each year somewhere in the U.S.

I consider this false advertising because Allstate knows better, and is purposely misleading the public to make more money.

Can Space.com Teach Us Anything Useful about Climate?

Monday, December 3rd, 2018

According to Space.com, Venus and Earth were really quite similar, until something went wrong. Horribly wrong.

I saw a Space.com article today entitled, Can Venus teach us to take climate change seriously? While Space.com writers should know quite a bit about the other planets, the article was a fount of misinformation and gross exaggeration.

The obvious purpose of the article was scare us into taking increasing carbon dioxide levels seriously, following on the Fourth National Climate Assessment (NC4) report (which I’m still trying to digest). After repeating the NC4 claim that “10 percent of the U.S. economy could evaporate by 2100” due to climate change, the Venusian silliness begins:

…a nearby world has an even hotter climate problem than ours, and scientists say we could learn some valuable lessons from it. That world is Venus, Earth’s “evil twin,” which was once nice enough until something went wrong and the atmosphere began trapping a little too much heat.

First of all, it is extremely speculative to claim that the climate of Venus “was once nice enough“. Then to further claim, “something went wrong and the atmosphere began trapping a little too much heat.” This makes it sound like Venus was just another hospitable planet until it reached some tipping point and a runaway greenhouse effect ensued.

This kind of prose might be good for science fiction, but it does a disservice to the facts.

While it is true that the surface of Venus has a temperature around 860 deg. F., the fact is that Venus has over 220,000 times as much CO2 as Earth’s atmosphere!

By way of comparison, since the Industrial Revolution started, it is widely believed we are now approaching 1.5 times as much atmospheric CO2 as we had hundreds of years ago.

220,000x versus 1.5x. Do you see the grotesqueness of comparing Venus to Earth?

If we used distances to make the comparison, and 1.5x was 1.5 inches, then 220,000x would be 2.3 miles! Imagine that the water level in the ocean increased by 0.5 inches, and people were trying to scare you about what might happen if it goes up another half an inch in the next 50 years by comparing it to 2.3 miles of water depth.

To make matters worse, the article then builds upon this Venus-is-so-much-like-Earth theme with the supposed reason why Venus is hotter than the Earth:

Much of the appeal of Venus comes from the fact that despite its horrifying modern appearance, it’s actually really similar to Earth. “Picture a planet that’s just like Earth but it’s a little hotter because it’s a little closer to the sun and that would be Venus,” David Grinspoon, a planetary scientist and astrobiologist at the Planetary Science Institute, told Space.com.

Wrong again, Dr. Planetary Scientist.

Because Venus is perpetually cloud-covered, it actually absorbs less sunlight than the Earth, even though it is closer to the sun. Were it not for its extreme greenhouse effect, its surface temperature would actually average colder than the Earth.

Using Venus to scare people about increasing CO2 levels on Earth is nothing new. But I’m surprised that a reputable website like Space.com would stoop to such a level of pseudo-science to support reductions in greenhouse gas emissions.

UAH Global Temperature Update for November, 2018: +0.28 deg. C

Monday, December 3rd, 2018

The Version 6.0 global average lower tropospheric temperature (LT) anomaly for November, 2018 was +0.28 deg. C, up a little from +0.22 deg. C in October:

Global area-averaged lower tropospheric temperature anomalies (departures from 30-year calendar monthly means, 1981-2010). The 13-month centered average is meant to give an indication of the lower frequency variations in the data; the choice of 13 months is somewhat arbitrary… an odd number of months allows centered plotting on months with no time lag between the two plotted time series. The inclusion of two of the same calendar months on the ends of the 13 month averaging period causes no issues with interpretation because the seasonal temperature cycle has been removed, and so has the distinction between calendar months.

Various regional LT departures from the 30-year (1981-2010) average for the last 23 months are:

YEAR MO GLOBE NHEM. SHEM. TROPIC USA48 ARCTIC AUST
2017 01 +0.33 +0.32 +0.34 +0.10 +0.28 +0.95 +1.22
2017 02 +0.39 +0.58 +0.20 +0.08 +2.16 +1.33 +0.21
2017 03 +0.23 +0.37 +0.09 +0.06 +1.22 +1.24 +0.98
2017 04 +0.28 +0.29 +0.27 +0.22 +0.90 +0.23 +0.40
2017 05 +0.45 +0.40 +0.50 +0.41 +0.11 +0.21 +0.06
2017 06 +0.22 +0.34 +0.10 +0.40 +0.51 +0.10 +0.34
2017 07 +0.29 +0.31 +0.28 +0.51 +0.61 -0.27 +1.03
2017 08 +0.41 +0.41 +0.42 +0.47 -0.54 +0.49 +0.78
2017 09 +0.55 +0.52 +0.58 +0.54 +0.30 +1.06 +0.60
2017 10 +0.63 +0.67 +0.60 +0.48 +1.22 +0.83 +0.86
2017 11 +0.36 +0.34 +0.38 +0.27 +1.36 +0.68 -0.12
2017 12 +0.42 +0.50 +0.33 +0.26 +0.45 +1.37 +0.36
2018 01 +0.26 +0.46 +0.06 -0.11 +0.59 +1.36 +0.43
2018 02 +0.20 +0.25 +0.16 +0.03 +0.92 +1.20 +0.18
2018 03 +0.25 +0.40 +0.10 +0.07 -0.31 -0.32 +0.60
2018 04 +0.21 +0.32 +0.11 -0.12 -0.00 +1.02 +0.69
2018 05 +0.18 +0.41 -0.05 +0.03 +1.94 +0.18 -0.39
2018 06 +0.21 +0.38 +0.04 +0.12 +1.20 +0.83 -0.55
2018 07 +0.32 +0.43 +0.21 +0.29 +0.51 +0.30 +1.37
2018 08 +0.19 +0.22 +0.17 +0.12 +0.07 +0.09 +0.26
2018 09 +0.15 +0.15 +0.14 +0.24 +0.88 +0.21 +0.19
2018 10 +0.22 +0.31 +0.12 +0.34 +0.25 +1.11 +0.39
2018 11 +0.28 +0.27 +0.29 +0.50 -1.13 +0.69 +0.53

The linear temperature trend of the global average lower tropospheric temperature anomalies from January 1979 through November 2018 remains at +0.13 C/decade.

The UAH LT global anomaly image for November, 2018 should be available in the next few days here.

The new Version 6 files should also be updated at that time, and are located here:

Lower Troposphere: http://vortex.nsstc.uah.edu/data/msu/v6.0/tlt/uahncdc_lt_6.0.txt
Mid-Troposphere: http://vortex.nsstc.uah.edu/data/msu/v6.0/tmt/uahncdc_mt_6.0.txt
Tropopause: http://vortex.nsstc.uah.edu/data/msu/v6.0/ttp/uahncdc_tp_6.0.txt
Lower Stratosphere: http://vortex.nsstc.uah.edu/data/msu/v6.0/tls/uahncdc_ls_6.0.txt

The Sorry State of Climate Science Peer Review, and Kudos to Nic Lewis

Wednesday, November 14th, 2018

For decades now those of us trying to publish papers which depart from the climate doom-and-gloom narrative have noticed a trend toward both biased and sloppy peer review of research submitted for publication in scientific journals.

Part of the problem is the increased specialization of climate science (and other sciences in general), so that there are relatively few peers who know enough about what they are reviewing to pass expert judgement on it. Instead, they simply give the paper author(s) the benefit of the doubt. I have been in this position many times when reviewing a paper for publication. This leads to group-think, as the number of experts in any sub-discipline dwindles.

If the conclusions of the paper support a more alarmist narrative on the seriousness of anthropogenic global warming, the less thorough will be the peer review. I am now totally convinced of that. If the paper is skeptical in tone, it endures levels of criticism that alarmist papers do not experience. I have had at least one paper rejected based upon a single reviewer who obviously didn’t read the paper…he criticized claims not even made in the paper.

A recent paper published in what is arguably the world’s most prestigious science journal, Nature, claimed that the oceans have been warming considerably faster than estimates made from actual thermometer measurements, which remain rather sparse even in the Argo float era.

Enter Nic Lewis, who along with Judith Curry has been publishing some of the most thorough estimates of climate sensitivity based upon the observational data and the usual assumed anthropogenic climate forcings (mostly increasing CO2). Despite not being a credentialed climate scientist, Mr. Lewis immediately identified a significant error in the paper, substantially altering the conclusions, which the authors now acknowledge.

The good news is that this is a case where the error was caught, and admitted to.

The bad news is that the peer review process, presumably involving credentialed climate scientists, should have caught the error before publication.

UAH Global Temperature Update for October, 2018: +0.22 deg. C

Friday, November 2nd, 2018

The Version 6.0 global average lower tropospheric temperature (LT) anomaly for October, 2018 was +0.22 deg. C, up a little from +0.14 deg. C in September:

Global area-averaged lower tropospheric temperature anomalies (departures from 30-year calendar monthly means, 1981-2010). The 13-month centered average is meant to give an indication of the lower frequency variations in the data; the choice of 13 months is somewhat arbitrary… an odd number of months allows centered plotting on months with no time lag between the two plotted time series. The inclusion of two of the same calendar months on the ends of the 13 month averaging period causes no issues with interpretation because the seasonal temperature cycle has been removed, and so has the distinction between calendar months.

Various regional LT departures from the 30-year (1981-2010) average for the last 22 months are:

YEAR MO GLOBE NHEM. SHEM. TROPIC USA48 ARCTIC AUST
2017 01 +0.33 +0.32 +0.34 +0.10 +0.28 +0.95 +1.22
2017 02 +0.39 +0.58 +0.20 +0.08 +2.16 +1.33 +0.21
2017 03 +0.23 +0.37 +0.09 +0.06 +1.22 +1.24 +0.98
2017 04 +0.28 +0.29 +0.26 +0.22 +0.90 +0.23 +0.40
2017 05 +0.45 +0.40 +0.49 +0.41 +0.11 +0.21 +0.06
2017 06 +0.22 +0.34 +0.10 +0.40 +0.51 +0.10 +0.34
2017 07 +0.29 +0.31 +0.28 +0.51 +0.61 -0.27 +1.03
2017 08 +0.41 +0.41 +0.42 +0.47 -0.54 +0.49 +0.78
2017 09 +0.55 +0.52 +0.57 +0.54 +0.30 +1.06 +0.60
2017 10 +0.63 +0.67 +0.60 +0.47 +1.22 +0.83 +0.86
2017 11 +0.36 +0.34 +0.38 +0.27 +1.36 +0.68 -0.12
2017 12 +0.42 +0.50 +0.33 +0.26 +0.45 +1.37 +0.36
2018 01 +0.26 +0.46 +0.06 -0.11 +0.59 +1.36 +0.42
2018 02 +0.20 +0.25 +0.16 +0.03 +0.92 +1.19 +0.18
2018 03 +0.25 +0.40 +0.10 +0.07 -0.32 -0.33 +0.59
2018 04 +0.21 +0.31 +0.11 -0.12 -0.00 +1.02 +0.69
2018 05 +0.18 +0.41 -0.05 +0.03 +1.93 +0.18 -0.39
2018 06 +0.21 +0.38 +0.04 +0.12 +1.19 +0.83 -0.55
2018 07 +0.32 +0.43 +0.21 +0.29 +0.51 +0.30 +1.37
2018 08 +0.19 +0.22 +0.17 +0.12 +0.06 +0.09 +0.26
2018 09 +0.14 +0.15 +0.14 +0.24 +0.88 +0.21 +0.19
2018 10 +0.22 +0.31 +0.12 +0.34 +0.25 +1.11 +0.38

The linear temperature trend of the global average lower tropospheric temperature anomalies from January 1979 through October 2018 remains at +0.13 C/decade.

The UAH LT global anomaly image for October, 2018 should be available in the next few days here.

The new Version 6 files should also be updated at that time, and are located here:

Lower Troposphere: http://vortex.nsstc.uah.edu/data/msu/v6.0/tlt/uahncdc_lt_6.0.txt
Mid-Troposphere: http://vortex.nsstc.uah.edu/data/msu/v6.0/tmt/uahncdc_mt_6.0.txt
Tropopause: http://vortex.nsstc.uah.edu/data/msu/v6.0/ttp/uahncdc_tp_6.0.txt
Lower Stratosphere: http://vortex.nsstc.uah.edu/data/msu/v6.0/tls/uahncdc_ls_6.0.txt

Florida Major Hurricane Strikes: Still No Trend

Thursday, October 11th, 2018

Note: The first plot had Michael’s wind speed plotted incorrectly, which has been fixed.

I’ve updated a plot of Florida major hurricane strikes since 1900 with Hurricane Michael, and the result is that there is still no trend in either intensity or frequency of strikes over the last 118 years:

This is based upon National Hurricane Center data. The trend line in intensity is flat, and the trend line in number of storms (not shown) is insignificantly downward.

Nevertheless, the usual fearmongers are claiming Hurricane Michael is somehow tied to climate change.

After all, the Gulf of Mexico is unusually warm, right?

Yes, but if you look at the history of Jul-Aug-Sept average sea surface temperature (SST) anomalies over the eastern Gulf (available here, 25N-30N, 80W-90W), you will see that since 1860, this summer is only the 9th warmest in the eastern Gulf of Mexico.

Even more astounding is that out of the top 10 warmest Gulf years since 1860, 7 occurred before 1970, which is before we experienced any significant warming.

So, all the “experts” can do is make vague claims about how major hurricanes like Michael are what we can expect more of in a warming world, but the data show that – so far at least – the data do not support the theory.

Major hurricanes are part of nature. As evidence of this, I will also remind people of the study of lake bottom sediments in Western Lake in the Florida panhandle, not far from where Michael made landfall, that showed the last 1,000 years have been relatively quiet for Category 4 to 5 hurricanes, but the period from 1,000 to 3,400 years ago was a “hyperactive” period for intense landfalls at that location.

Hurricane strikes in the U.S. are notoriously variable, as evidenced by the recent (and unprecedented) 11+ year “drought” in major hurricane landfalls, which was finally broken in 2017.

Where were the claims that the hurricane drought was due to global warming?

Crickets.

Attributing the latest hurricane in any way to global warming is the ultimate in cherry-picking the data. In fact, they don’t even show the data.

Which brings us back to those vague claims by the experts.

UPDATE:

I also included Michael in the count of ALL U.S. landfalling major hurricanes, again from NHC data. The marked downward trend since the 1930s, 40s, and 50s is quite evident:

Where is the news story about THAT?

More crickets.

New Record Low Tornado Count as of October 3

Thursday, October 4th, 2018

NOAA’s Storm Prediction Center keeps a daily count of cumulative number of tornadoes in the U.S. each year, and recent years have had an unusually low number of tornadoes.

As of October 3, the cumulative total for 2018 is 759; the previous lowest number of tornadoes for this date was 761. The SPC has records extending back 65 years.

This lack of tornadic storms in recent years should also correlate with lesser severe thunderstorm activity in general in the U.S., since the conditions which produce large hail and damaging winds are generally the same as are required for tornadoes (strong instability, plentiful moisture, and wind shear).