
 Home/Blog
The Version 6.1 global average lower tropospheric temperature (LT) anomaly for September, 2026 was +0.61 deg. C departure from the 1991-2020 mean, down from the August, 2026 value of +0.68 deg. C.
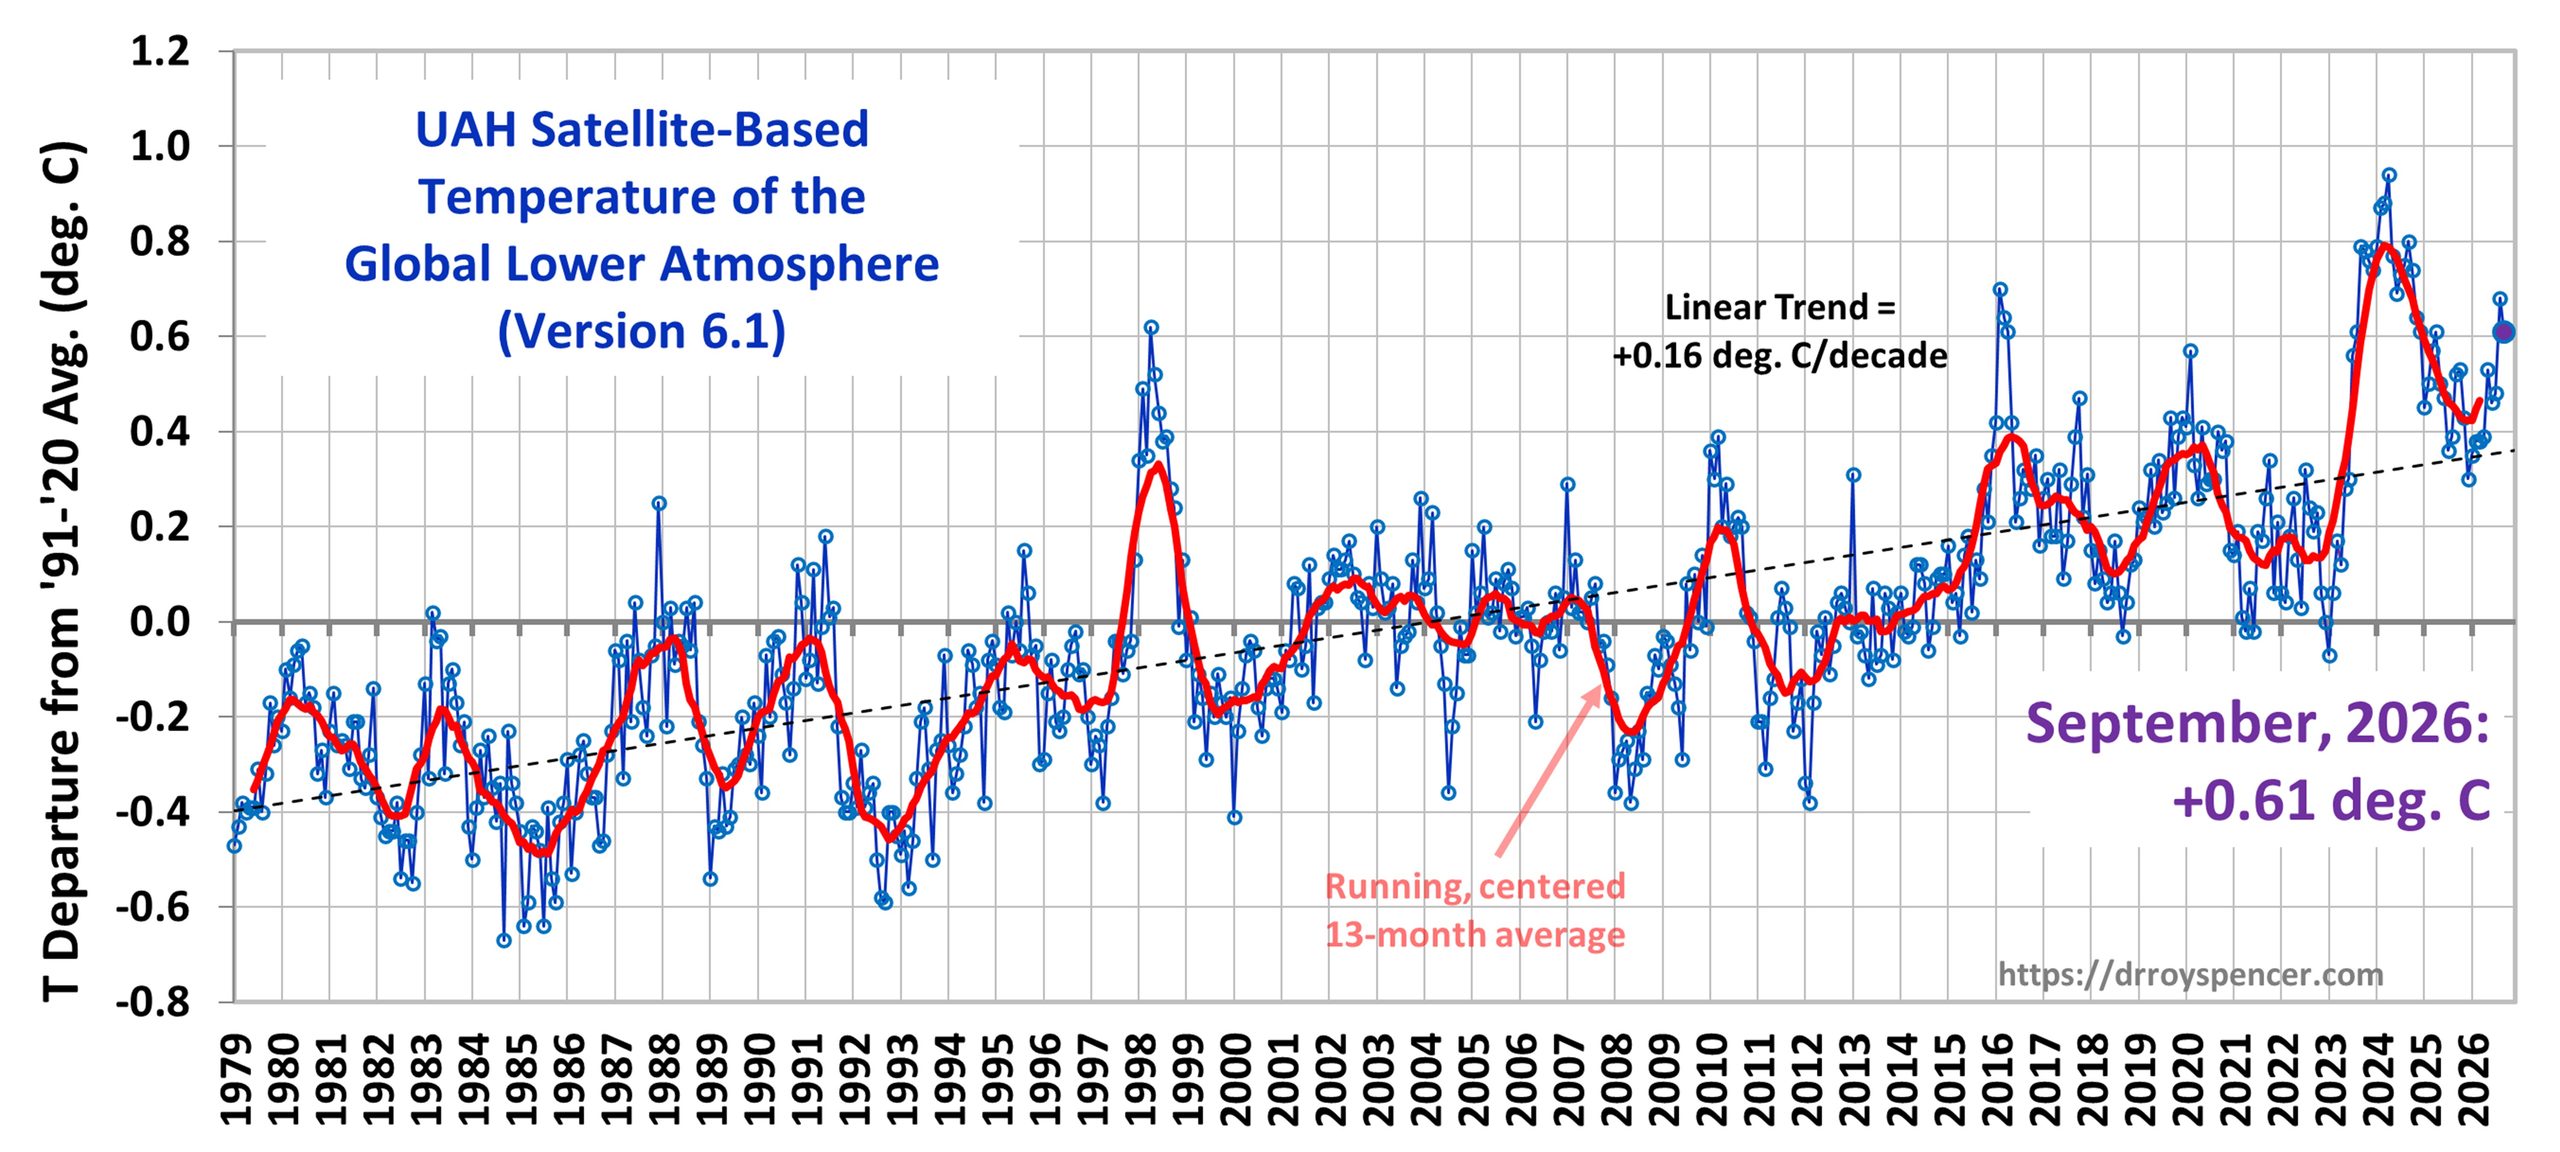
The Version 6.1 global area-averaged linear temperature trend (January 1979 through September 2026) remains at +0.16 deg/ C/decade (+0.22 C/decade over land, +0.13 C/decade over oceans).
The following table lists various regional Version 6.1 LT departures from the 30-year (1991-2020) average for the last 33 months (record highs are in red).
| Year | Mon | Globe | NHem | SHem | Tropic | US48 | Arctic | Aust. | Can. |
| 2024 | Jan | +0.80 | +1.02 | +0.57 | +1.20 | -0.19 | +0.40 | +1.12 | +0.97 |
| 2024 | Feb | +0.88 | +0.94 | +0.81 | +1.16 | +1.31 | +0.85 | +1.16 | +2.45 |
| 2024 | Mar | +0.88 | +0.96 | +0.80 | +1.25 | +0.22 | +1.05 | +1.34 | +1.12 |
| 2024 | Apr | +0.94 | +1.12 | +0.76 | +1.15 | +0.86 | +0.88 | +0.54 | +1.39 |
| 2024 | May | +0.77 | +0.77 | +0.78 | +1.20 | +0.04 | +0.20 | +0.52 | +0.67 |
| 2024 | June | +0.69 | +0.78 | +0.60 | +0.85 | +1.36 | +0.63 | +0.91 | +0.19 |
| 2024 | July | +0.73 | +0.86 | +0.61 | +0.96 | +0.44 | +0.56 | -0.07 | +1.15 |
| 2024 | Aug | +0.75 | +0.81 | +0.69 | +0.74 | +0.40 | +0.88 | +1.75 | +1.36 |
| 2024 | Sep | +0.81 | +1.04 | +0.58 | +0.82 | +1.31 | +1.48 | +0.98 | |
| 2024 | Oct | +0.75 | +0.89 | +0.60 | +0.63 | +1.89 | +0.81 | +1.09 | +0.89 |
| 2024 | Nov | +0.64 | +0.87 | +0.40 | +0.53 | +1.11 | +0.79 | +1.00 | +1.61 |
| 2024 | Dec | +0.61 | +0.75 | +0.47 | +0.52 | +1.41 | +1.12 | +1.54 | +1.65 |
| 2025 | Jan | +0.45 | +0.70 | +0.21 | +0.24 | -1.07 | +0.74 | +0.48 | +1.04 |
| 2025 | Feb | +0.50 | +0.55 | +0.45 | +0.26 | +1.03 | +2.10 | +0.87 | -0.35 |
| 2025 | Mar | +0.57 | +0.73 | +0.41 | +0.40 | +1.24 | +1.23 | +1.20 | +0.80 |
| 2025 | Apr | +0.61 | +0.76 | +0.46 | +0.36 | +0.81 | +0.85 | +1.21 | +0.45 |
| 2025 | May | +0.50 | +0.45 | +0.55 | +0.30 | +0.15 | +0.75 | +0.98 | +0.81 |
| 2025 | June | +0.48 | +0.48 | +0.47 | +0.30 | +0.80 | +0.05 | +0.39 | -0.22 |
| 2025 | July | +0.36 | +0.49 | +0.23 | +0.45 | +0.32 | +0.40 | +0.53 | -0.23 |
| 2025 | Aug | +0.39 | +0.39 | +0.39 | +0.16 | -0.06 | +0.82 | +0.11 | +0.62 |
| 2025 | Sep | +0.53 | +0.56 | +0.49 | +0.35 | +0.38 | +0.77 | +0.30 | +2.44 |
| 2025 | Oct | +0.53 | +0.52 | +0.55 | +0.24 | +1.12 | +1.42 | +1.67 | +2.59 |
| 2025 | Nov | +0.43 | +0.59 | +0.27 | +0.24 | +1.32 | +0.78 | +0.36 | +1.47 |
| 2025 | Dec | +0.30 | +0.45 | +0.15 | +0.19 | +2.10 | +0.32 | +0.37 | -1.86 |
| 2026 | Jan | +0.35 | +0.51 | +0.19 | +0.09 | +0.30 | +1.40 | +0.95 | +1.17 |
| 2026 | Feb | +0.39 | +0.54 | +0.23 | +0.03 | +1.91 | -0.48 | +0.73 | +0.32 |
| 2026 | Mar | +0.38 | +0.33 | +0.42 | +0.07 | +3.74 | -0.48 | +1.14 | -3.17 |
| 2026 | Apr | +0.39 | +0.43 | +0.34 | +0.23 | +1.20 | +0.30 | +0.70 | -0.89 |
| 2026 | May | +0.53 | +0.46 | +0.60 | +0.58 | +0.21 | +0.34 | +0.10 | +0.21 |
| 2026 | June | +0.46 | +0.54 | +0.38 | +0.57 | +0.64 | +1.01 | +0.38 | +0.99 |
| 2026 | July | +0.48 | +0.68 | +0.27 | +0.85 | +1.14 | +0.53 | -0.22 | +0.78 |
| 2026 | Aug | +0.68 | +0.76 | +0.59 | +0.90 | +0.60 | +0.80 | +0.39 | +0.71 |
| 2026 | Sep | +0.61 | +0.78 | +0.44 | +0.89 | +1.32 | +0.80 | +1.13 | +0.99 |
| Year | Mon | Globe | NHem | SHem | Tropic | US48 | Arctic | Aust. | Can. |
Time Series Plots for Tropics, USA48, Canada, and Australia
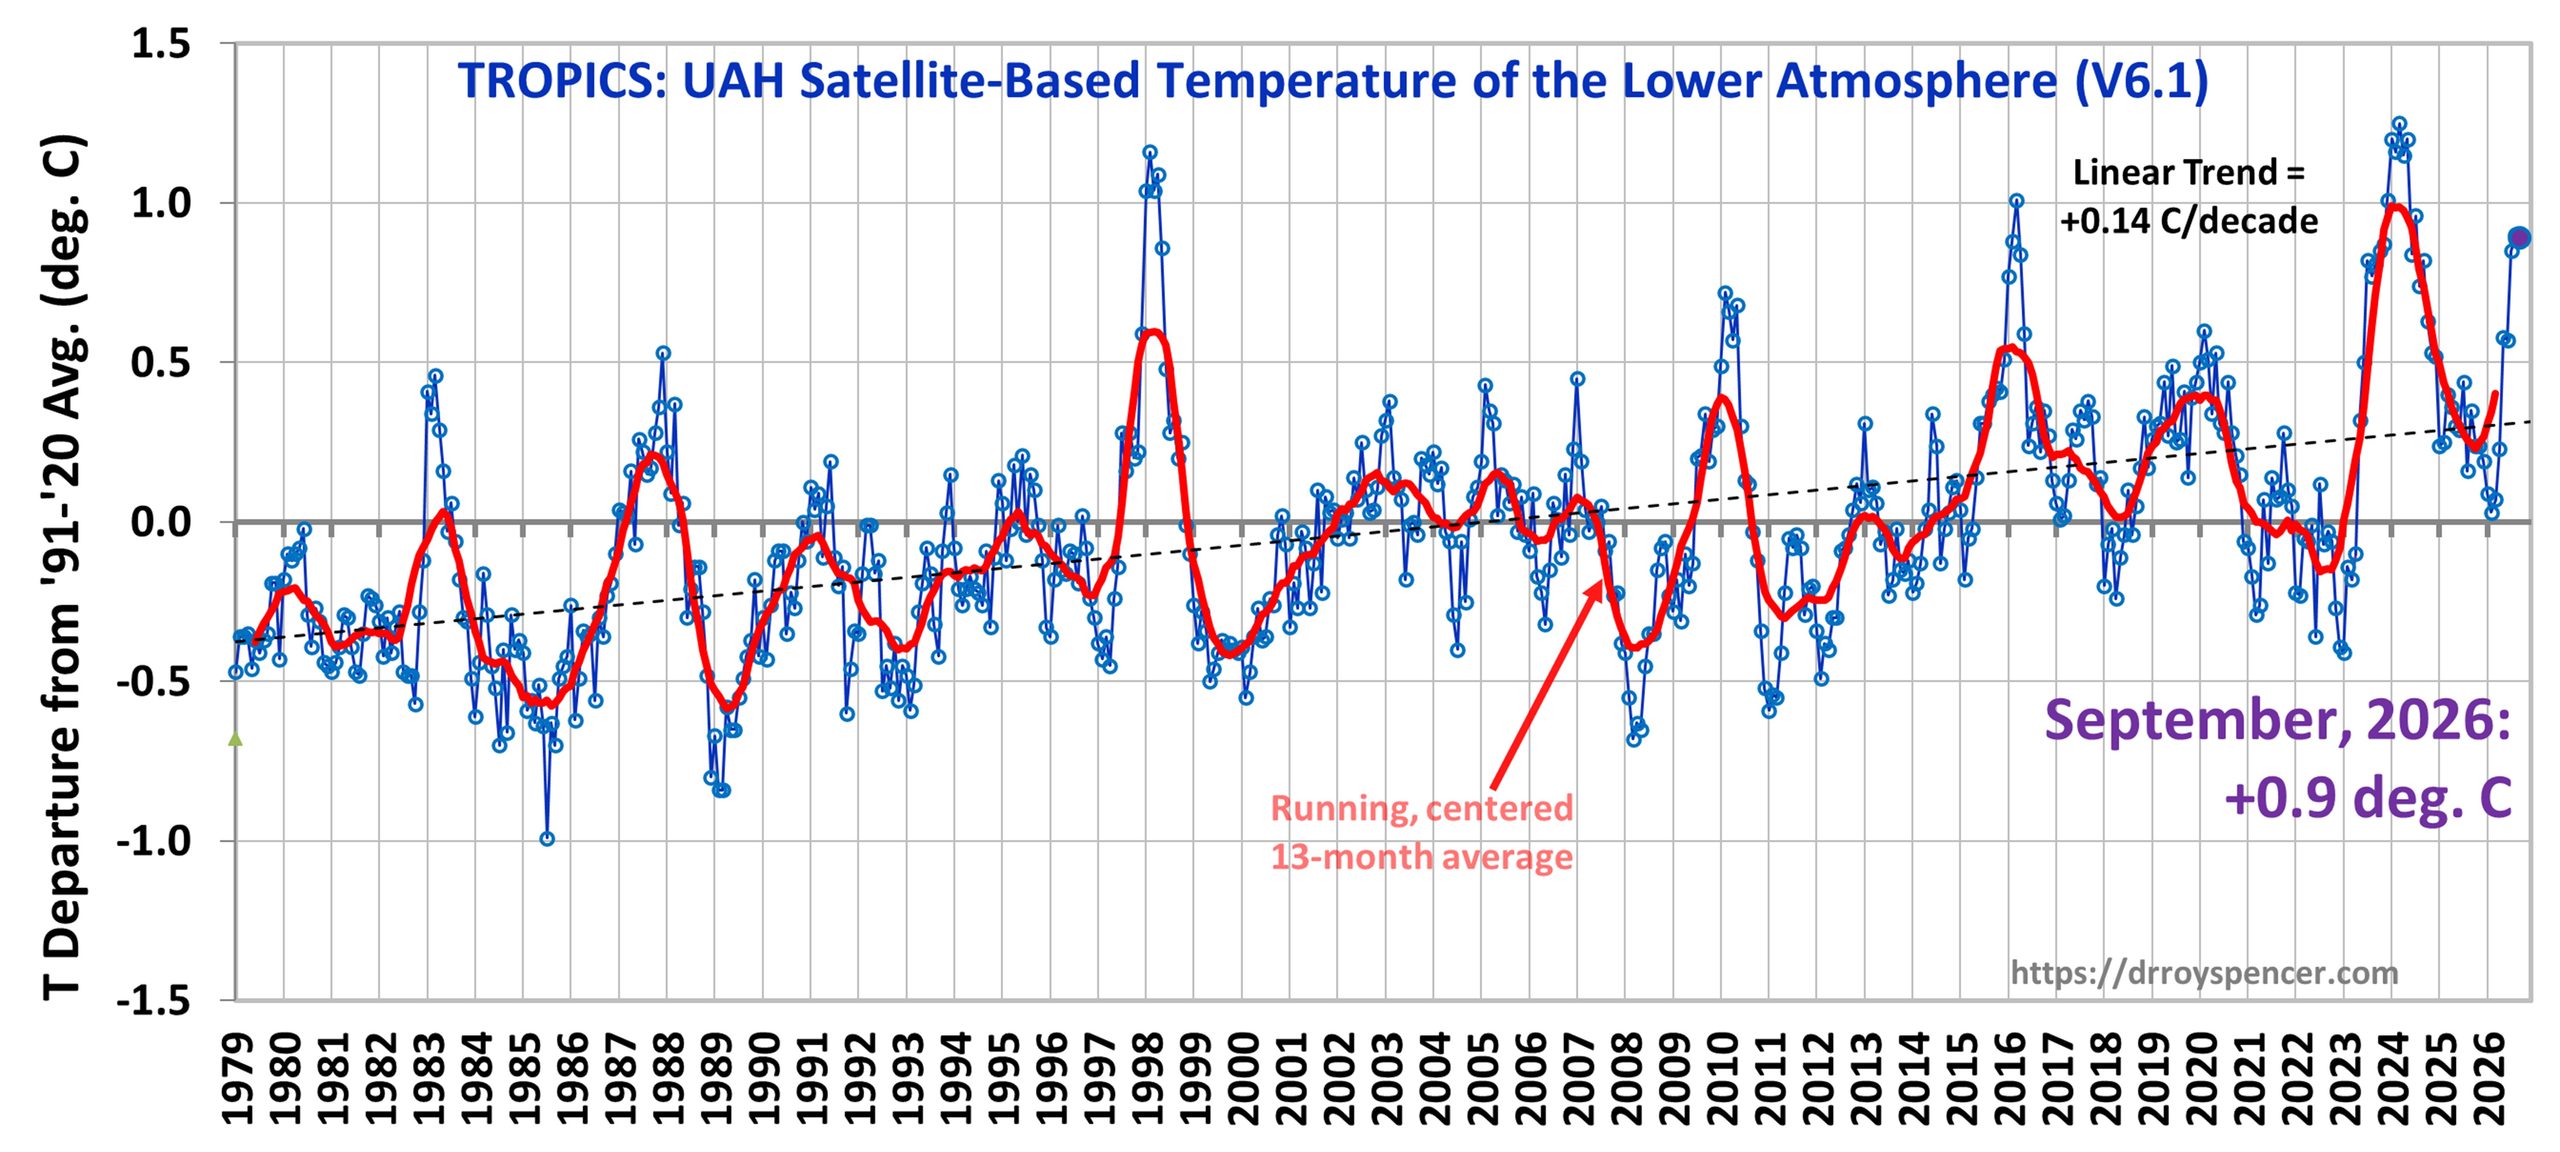
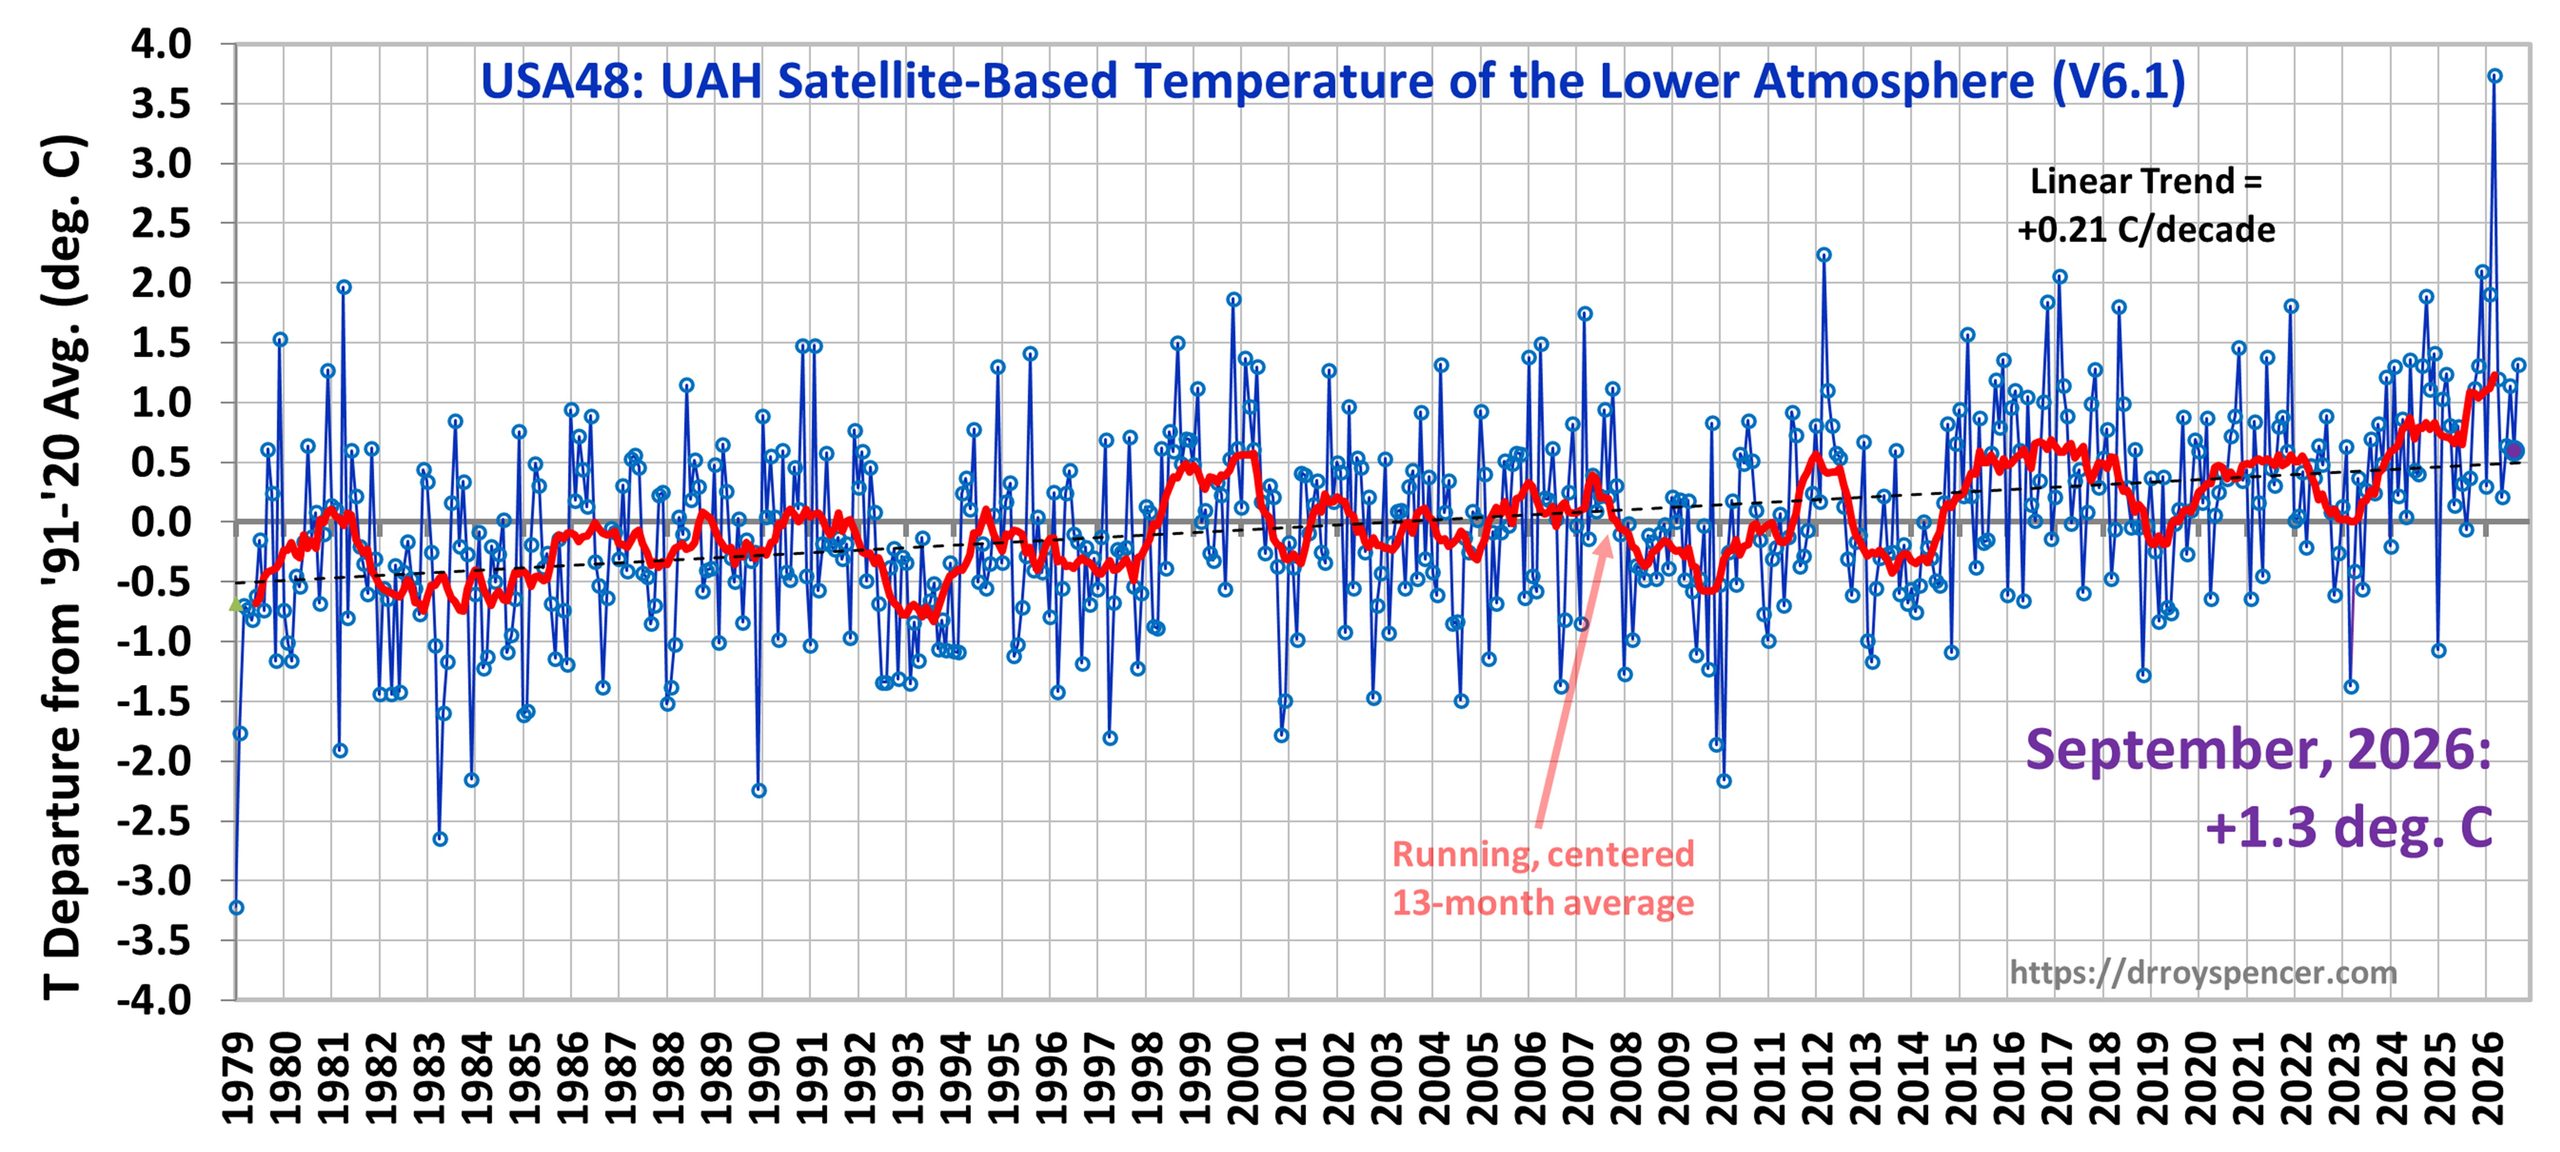
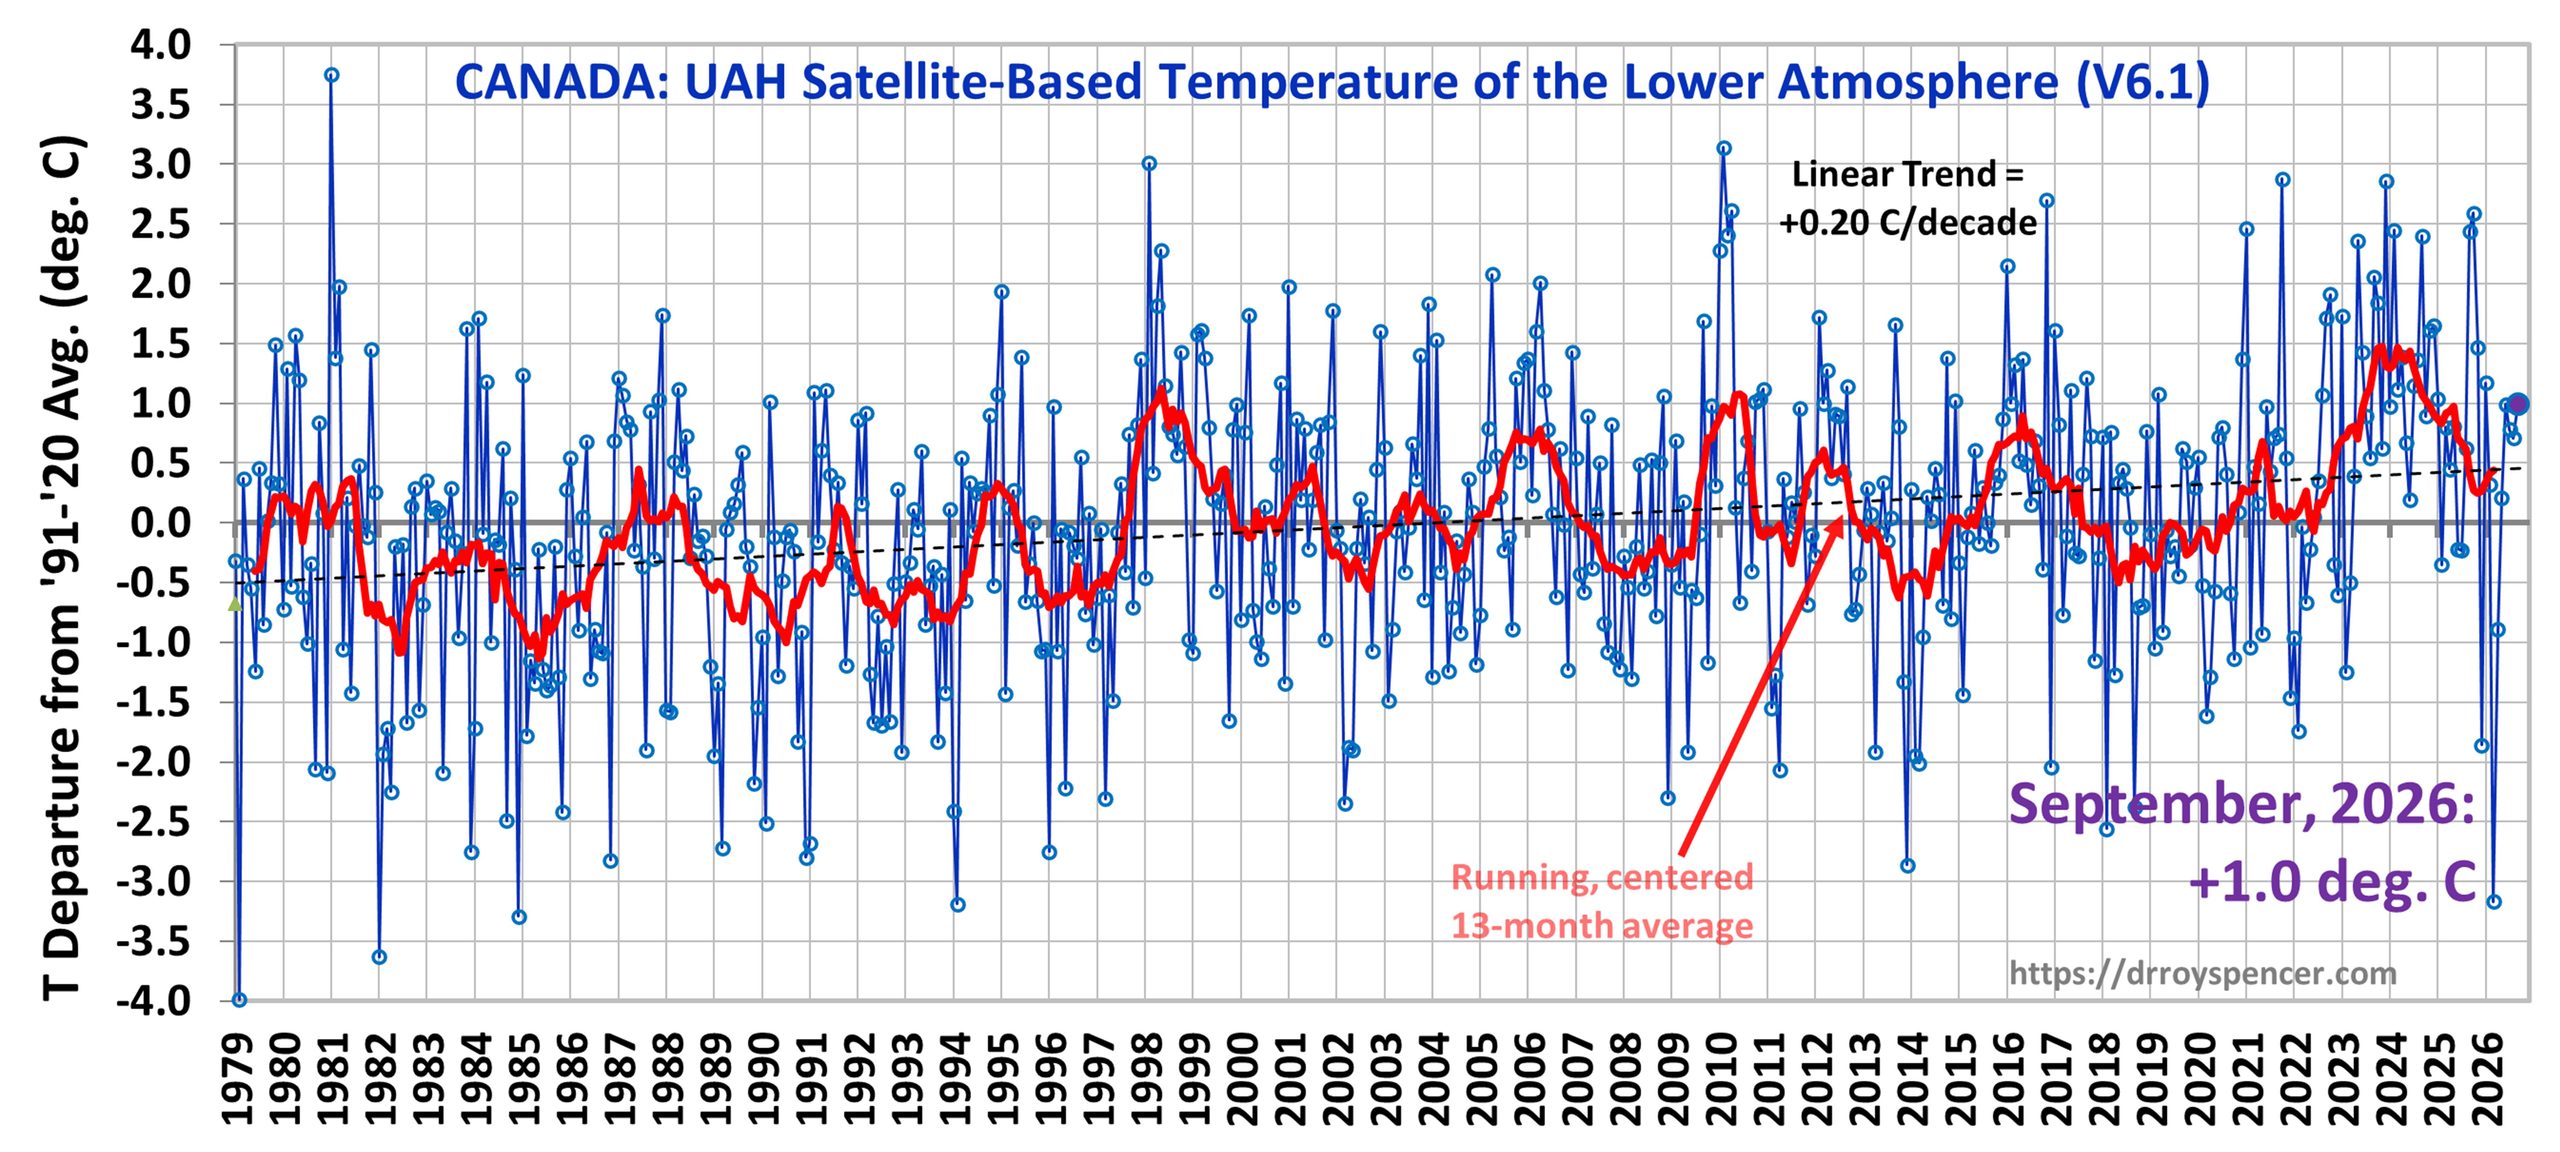
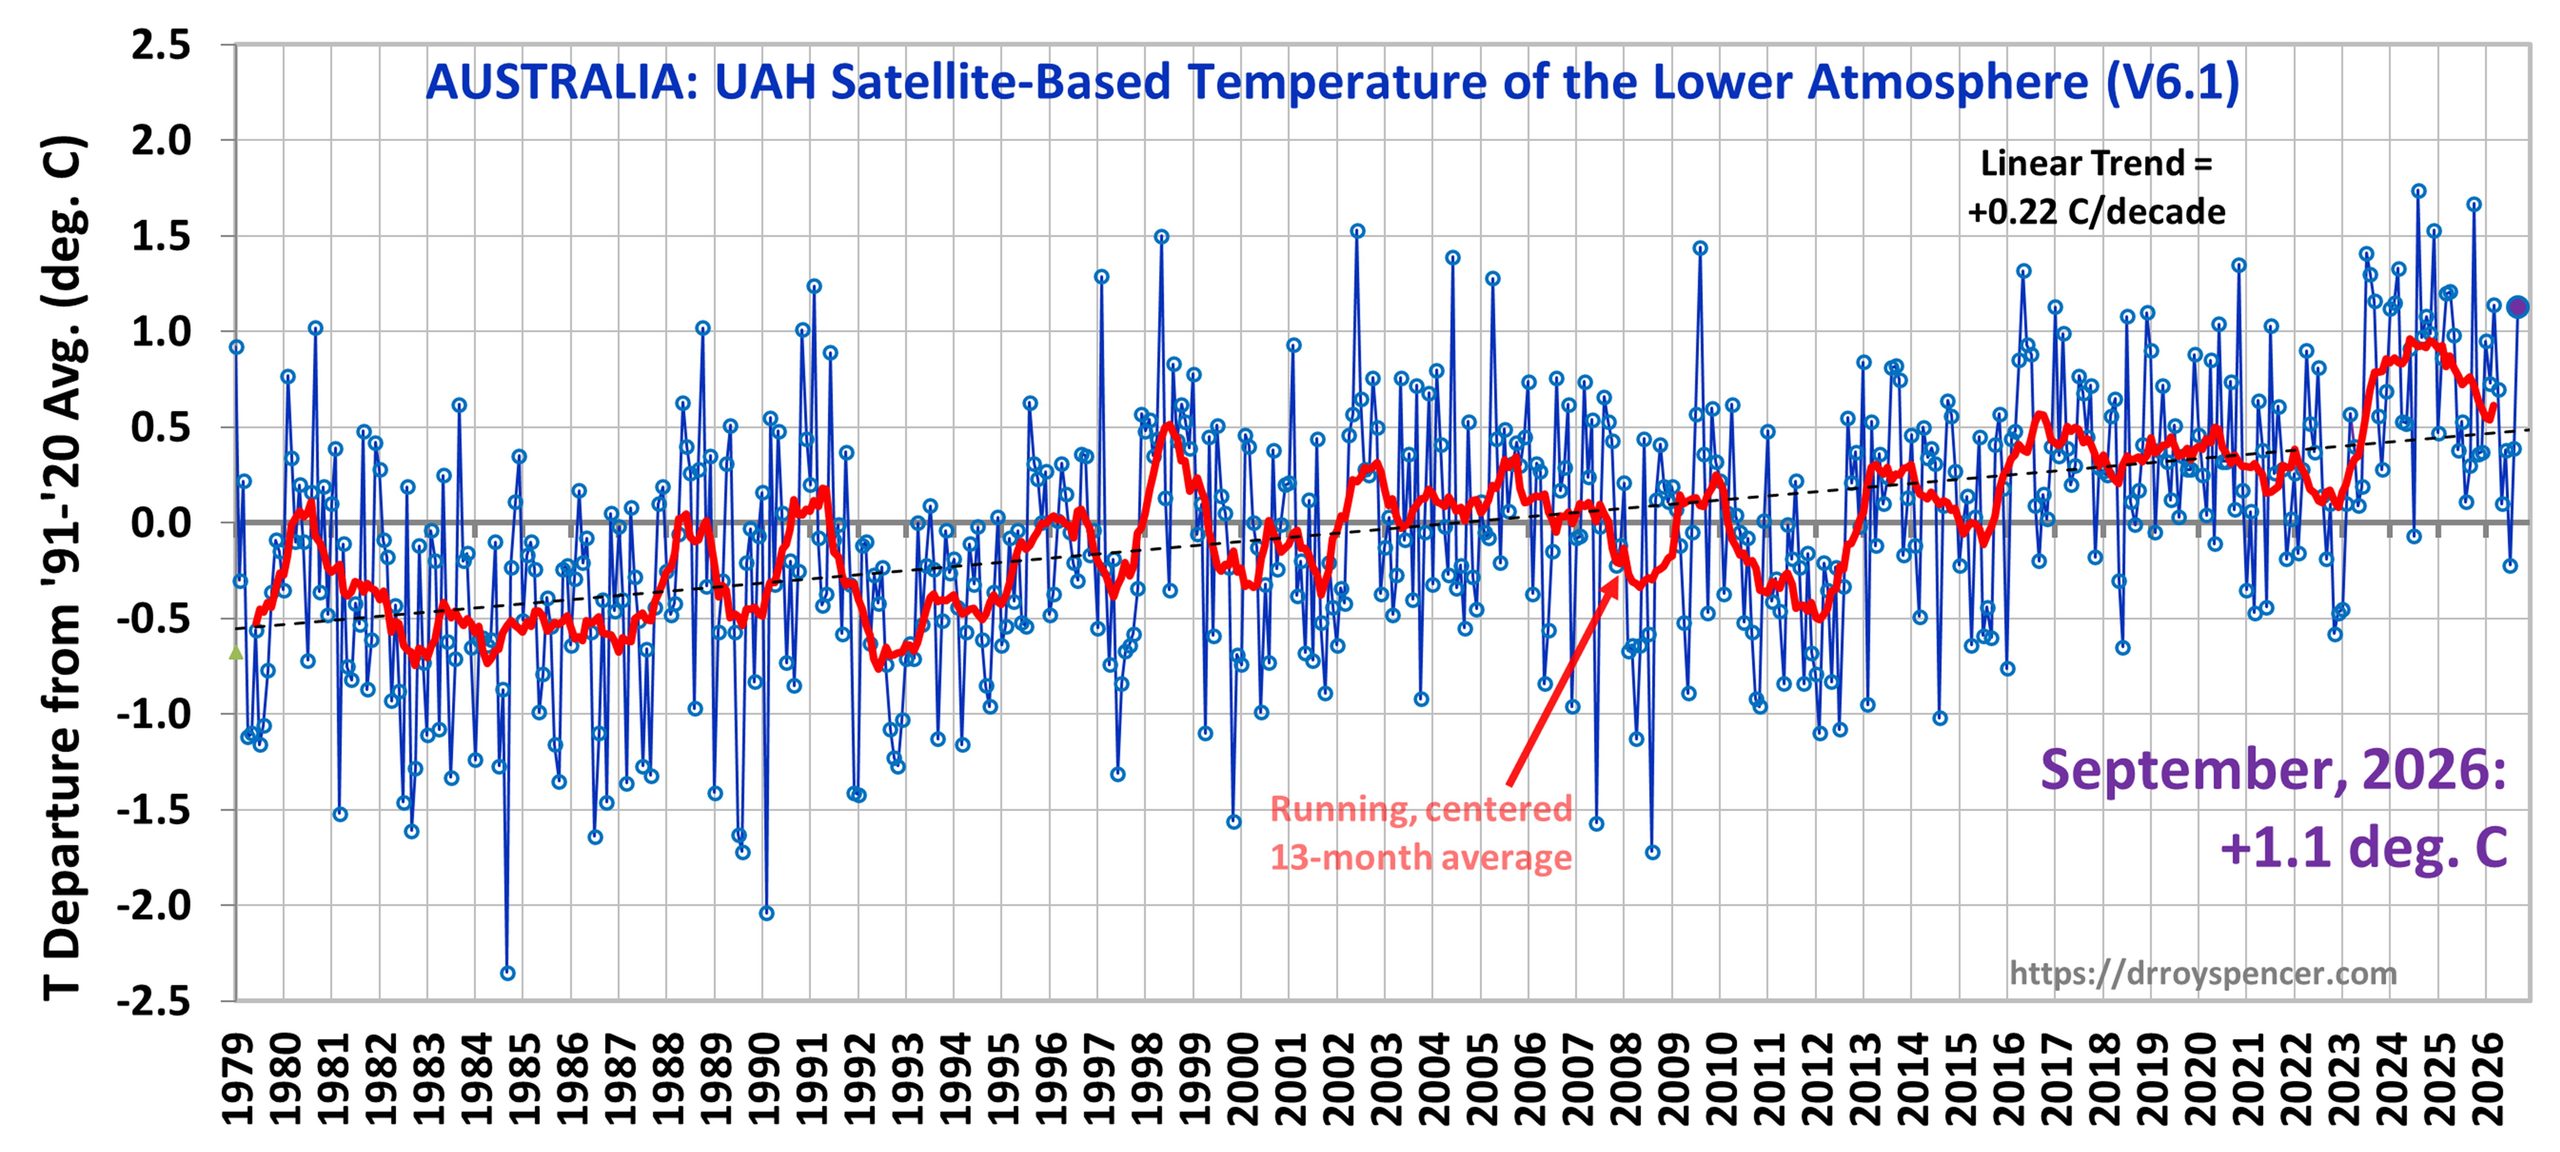
The full UAH Global Temperature Report, along with the LT global gridpoint anomaly map for September, 2026 and a more detailed analysis by John Christy, should be available within the next several days here.
The monthly anomalies for various regions for the four deep layers we monitor from satellites will be available in the next several days at the following locations:





A second-order polynomial fits the observation than a a linear model; the slope of the polynomial is currently 0.29 C per decade.
Why do you prefer a polynomial over a linear fit? Polynomials rarely have any predictive value – especially at edges.
The 2nd order polynomial fits better than a linear model, so it’s a better description of the observations over the 1979-2026 period. It shows that there has been an acceleration of warming.
I didn’t say anything about prediction, and agree that extrapolation is risky. But the linear model likely also has poor predictive value, given the observed acceleration of warming.
I think the new Monckton Pause just grew a bit longer.
44 months.
Very interesting!
The September Global anomaly is slightly lower than August. And that’s even with ENSO ablaze:
https://postimg.cc/rzHxww3w
I call that a slight win for the Polar Vortex, which has been also raging hitting max wind speeds close to 300mph. But as the PV moves to the North, ENSO will win, resulting in much higher anomaly for October.
As others have noted, El Niño results in ocean cooling. As seen from the chart above, the other oceans are already cool. After this El Niño is finished we’re likely heading for global cooling. Is this lomg natural warming trend finally over?
Very faint sunspots on the solar disk.
https://i.ibb.co/TDFLT317/latest.jpg